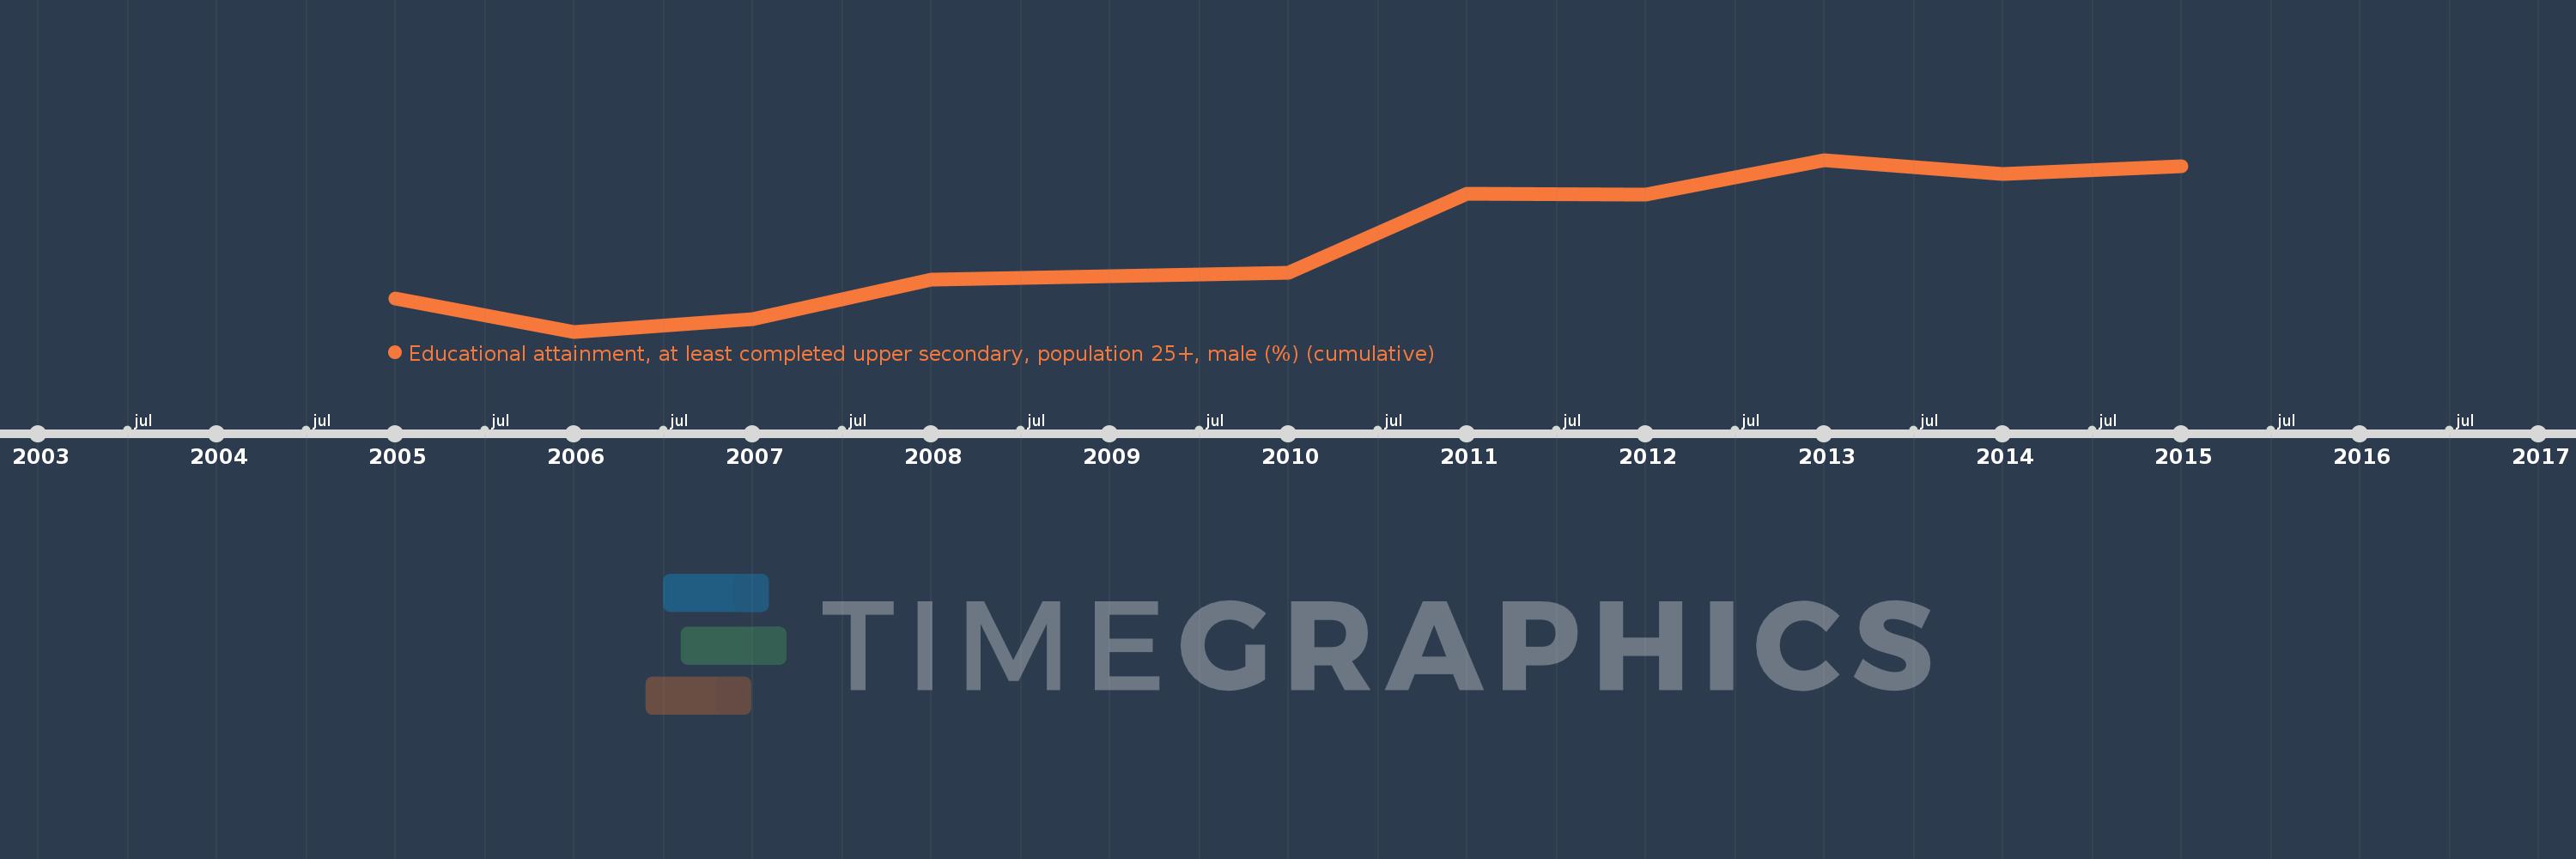
Questa scala temporale mostra un grafico dal 2005 anno al 2015 anno. Peru. I dati fino ad 2004 anno non disponibili. Il numero di osservazioni attuali secondo i date: 11.
La fonte (nome):
Indicatori dello sviluppo mondiale
La fonte (organizzazione):
United Nations Educational, Scientific, and Cultural Organization (UNESCO) Institute for Statistics.
Categorie:
Education, Gender
sono stati aggiornati
23 apr 2017 anni
Indicatori delle variazioni dei valori per anni
In media:
54.643
Minima:
47.849
1 gen 2006 anni
Massimo:
60.934
1 gen 2013 anni
Alla data di osservazione
Valore
Variazione assoluta
La variazione rispetto al valore precedente
1 gen 2005 anni
50.352
+50.352
0.0%
1 gen 2006 anni
47.849
-2.503
-4.97%
1 gen 2007 anni
48.817
+0.968
2.02%
1 gen 2008 anni
51.786
+2.969
6.08%
1 gen 2009 anni
52.091
+0.305
0.59%
1 gen 2010 anni
52.358
+0.267
0.51%
1 gen 2011 anni
58.32
+5.962
11.39%
1 gen 2012 anni
58.279
-0.041
-0.07%
1 gen 2013 anni
60.934
+2.654
4.55%
1 gen 2014 anni
59.828
-1.105
-1.81%
1 gen 2015 anni
60.458
+0.63
1.05%
Classificazione dei paesi secondo i statistiche attuali per anni