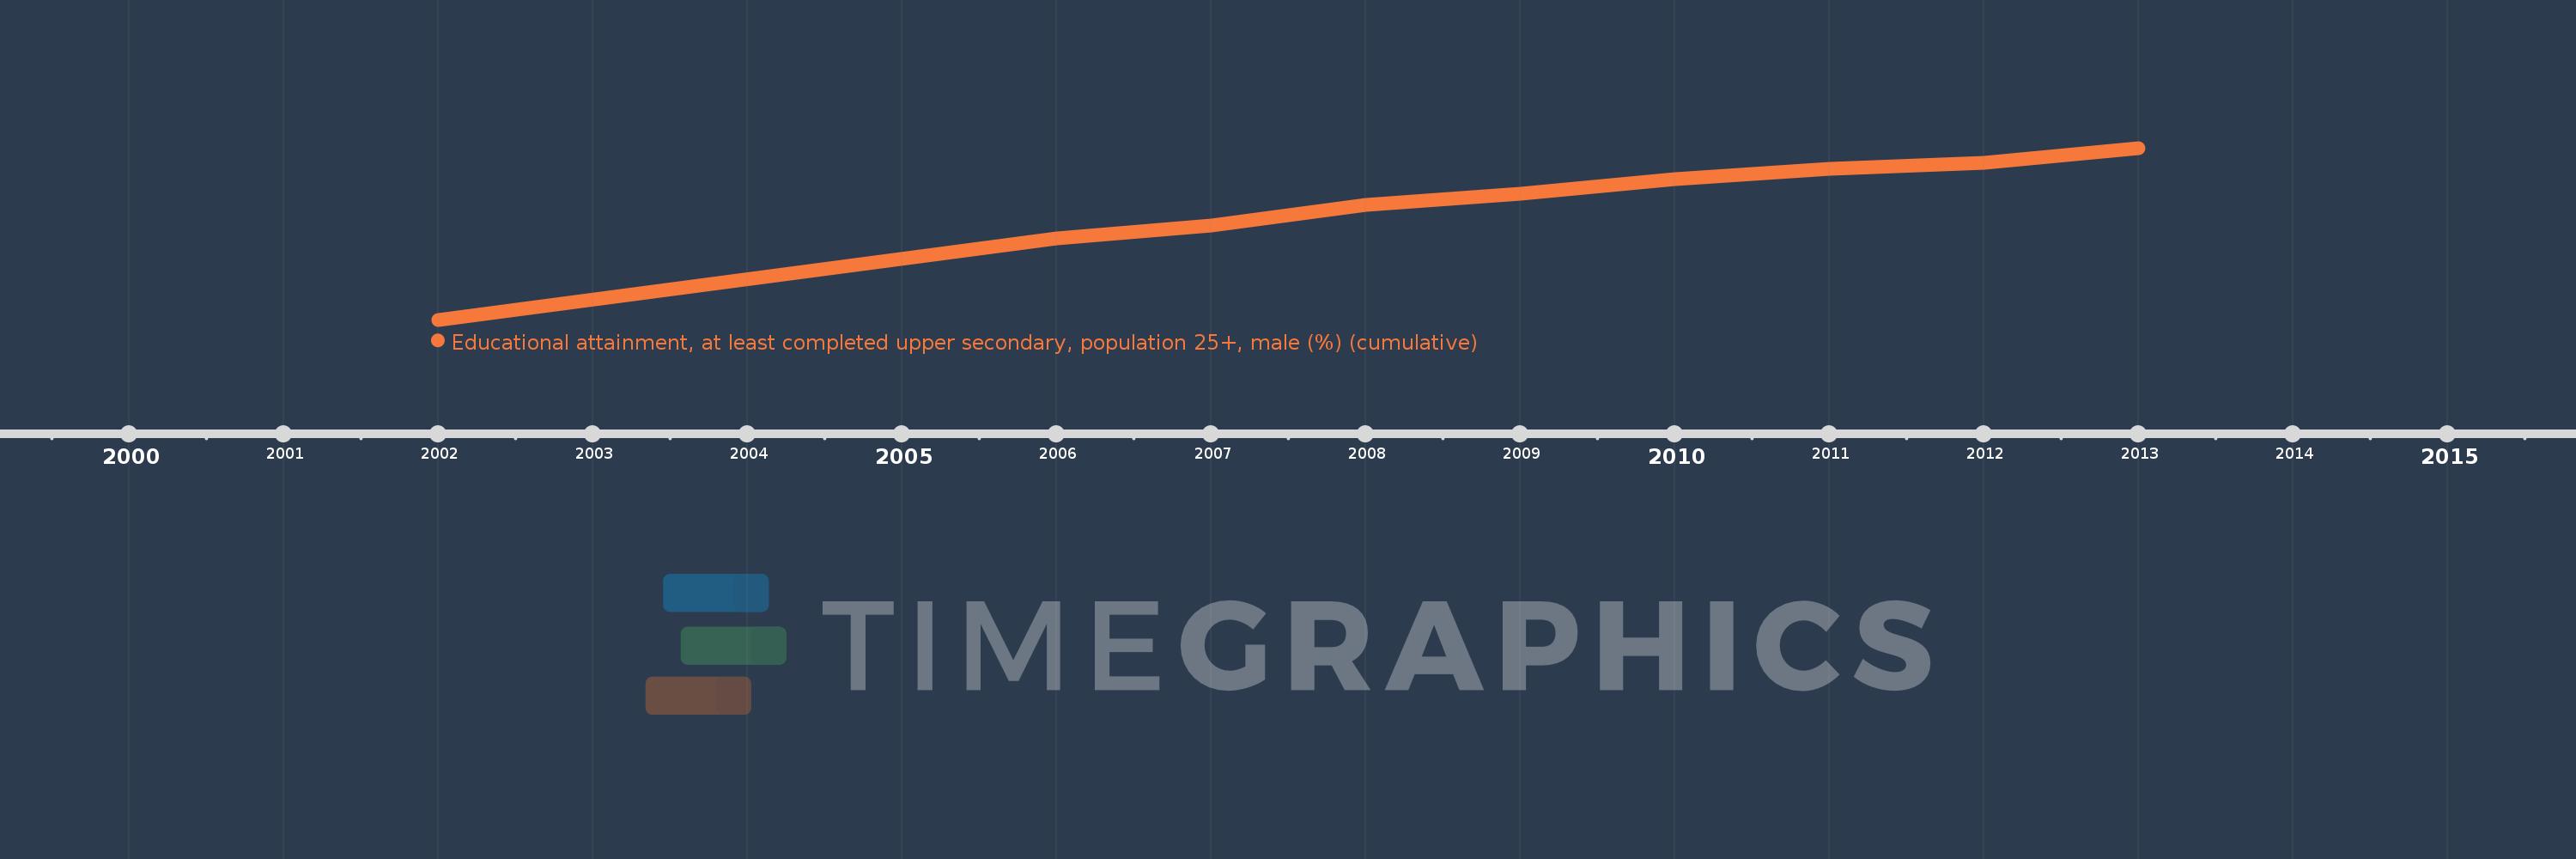
Questa scala temporale mostra un grafico dal 2002 anno al 2013 anno. Italy. I dati fino ad 2001 anno non disponibili. Il numero di osservazioni attuali secondo i date: 9.
La fonte (nome):
Indicatori dello sviluppo mondiale
La fonte (organizzazione):
United Nations Educational, Scientific, and Cultural Organization (UNESCO) Institute for Statistics.
Categorie:
Education, Gender
sono stati aggiornati
23 apr 2017 anni
Indicatori delle variazioni dei valori per anni
In media:
44.691
Minima:
37.236
1 gen 2002 anni
Massimo:
48.365
1 gen 2013 anni
Alla data di osservazione
Valore
Variazione assoluta
La variazione rispetto al valore precedente
1 gen 2002 anni
37.236
+37.236
0.0%
1 gen 2006 anni
42.492
+5.256
14.12%
1 gen 2007 anni
43.321
+0.829
1.95%
1 gen 2008 anni
44.654
+1.333
3.08%
1 gen 2009 anni
45.379
+0.725
1.62%
1 gen 2010 anni
46.331
+0.952
2.1%
1 gen 2011 anni
47.03
+0.699
1.51%
1 gen 2012 anni
47.416
+0.386
0.82%
1 gen 2013 anni
48.365
+0.949
2.0%
Classificazione dei paesi secondo i statistiche attuali per anni