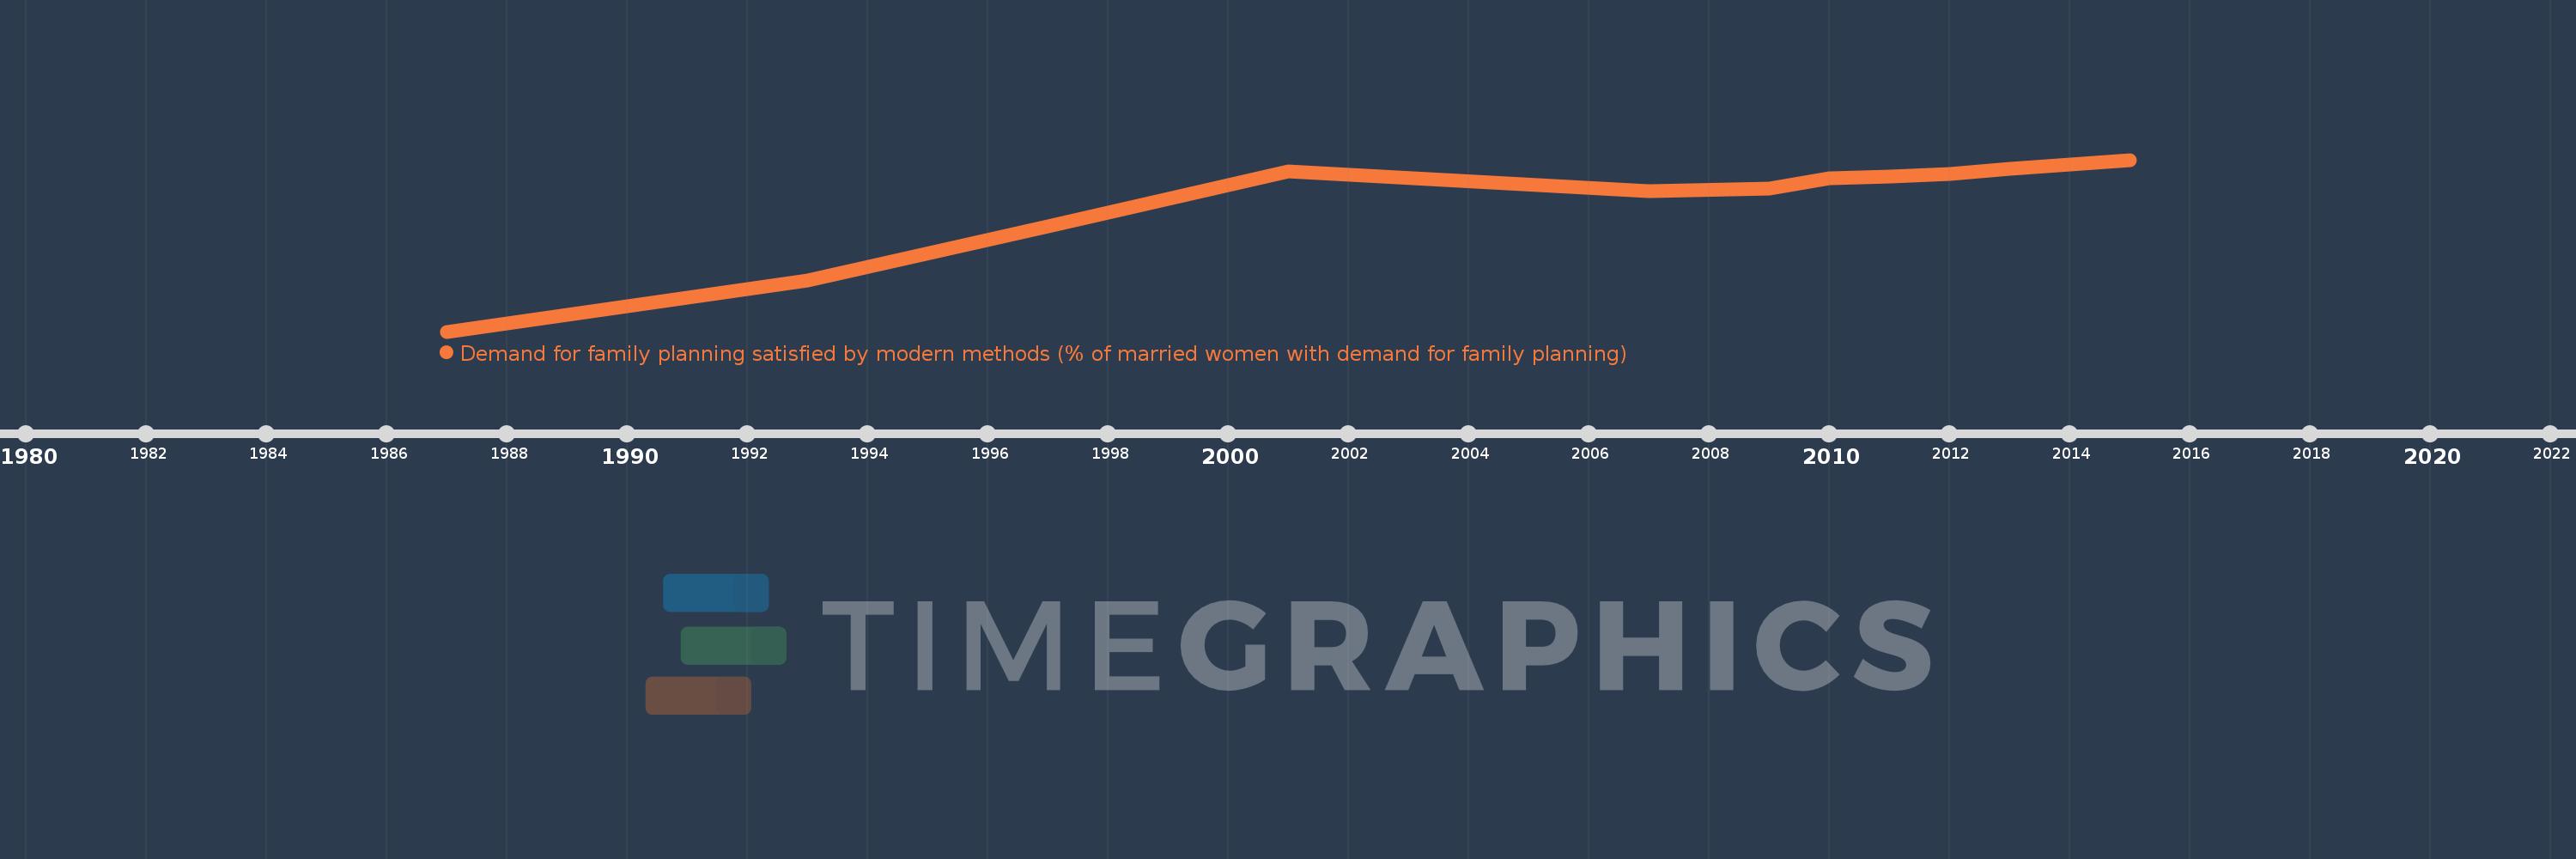
Questa scala temporale mostra un grafico dal 1987 anno al 2015 anno. Peru. I dati fino ad 1986 anno non disponibili. Il numero di osservazioni attuali secondo i date: 12.
La fonte (nome):
Indicatori dello sviluppo mondiale
La fonte (organizzazione):
Demographic and Health Surveys (DHS).
Categorie:
Health
sono stati aggiornati
23 apr 2017 anni
Indicatori delle variazioni dei valori per anni
In media:
55.183
Minima:
31.3
1 gen 1987 anni
Massimo:
62.7
1 gen 2015 anni
Alla data di osservazione
Valore
Variazione assoluta
La variazione rispetto al valore precedente
1 gen 1987 anni
31.3
+31.3
0.0%
1 gen 1993 anni
40.7
+9.4
30.03%
1 gen 1997 anni
50.5
+9.8
24.08%
1 gen 2001 anni
60.6
+10.1
20.0%
1 gen 2007 anni
57.0
-3.6
-5.94%
1 gen 2009 anni
57.4
+0.4
0.7%
1 gen 2010 anni
59.4
+2.0
3.48%
1 gen 2011 anni
59.6
+0.2
0.34%
1 gen 2012 anni
60.1
+0.5
0.84%
1 gen 2013 anni
61.1
+1.0
1.66%
1 gen 2014 anni
61.8
+0.7
1.15%
1 gen 2015 anni
62.7
+0.9
1.46%
Classificazione dei paesi secondo i statistiche attuali per anni