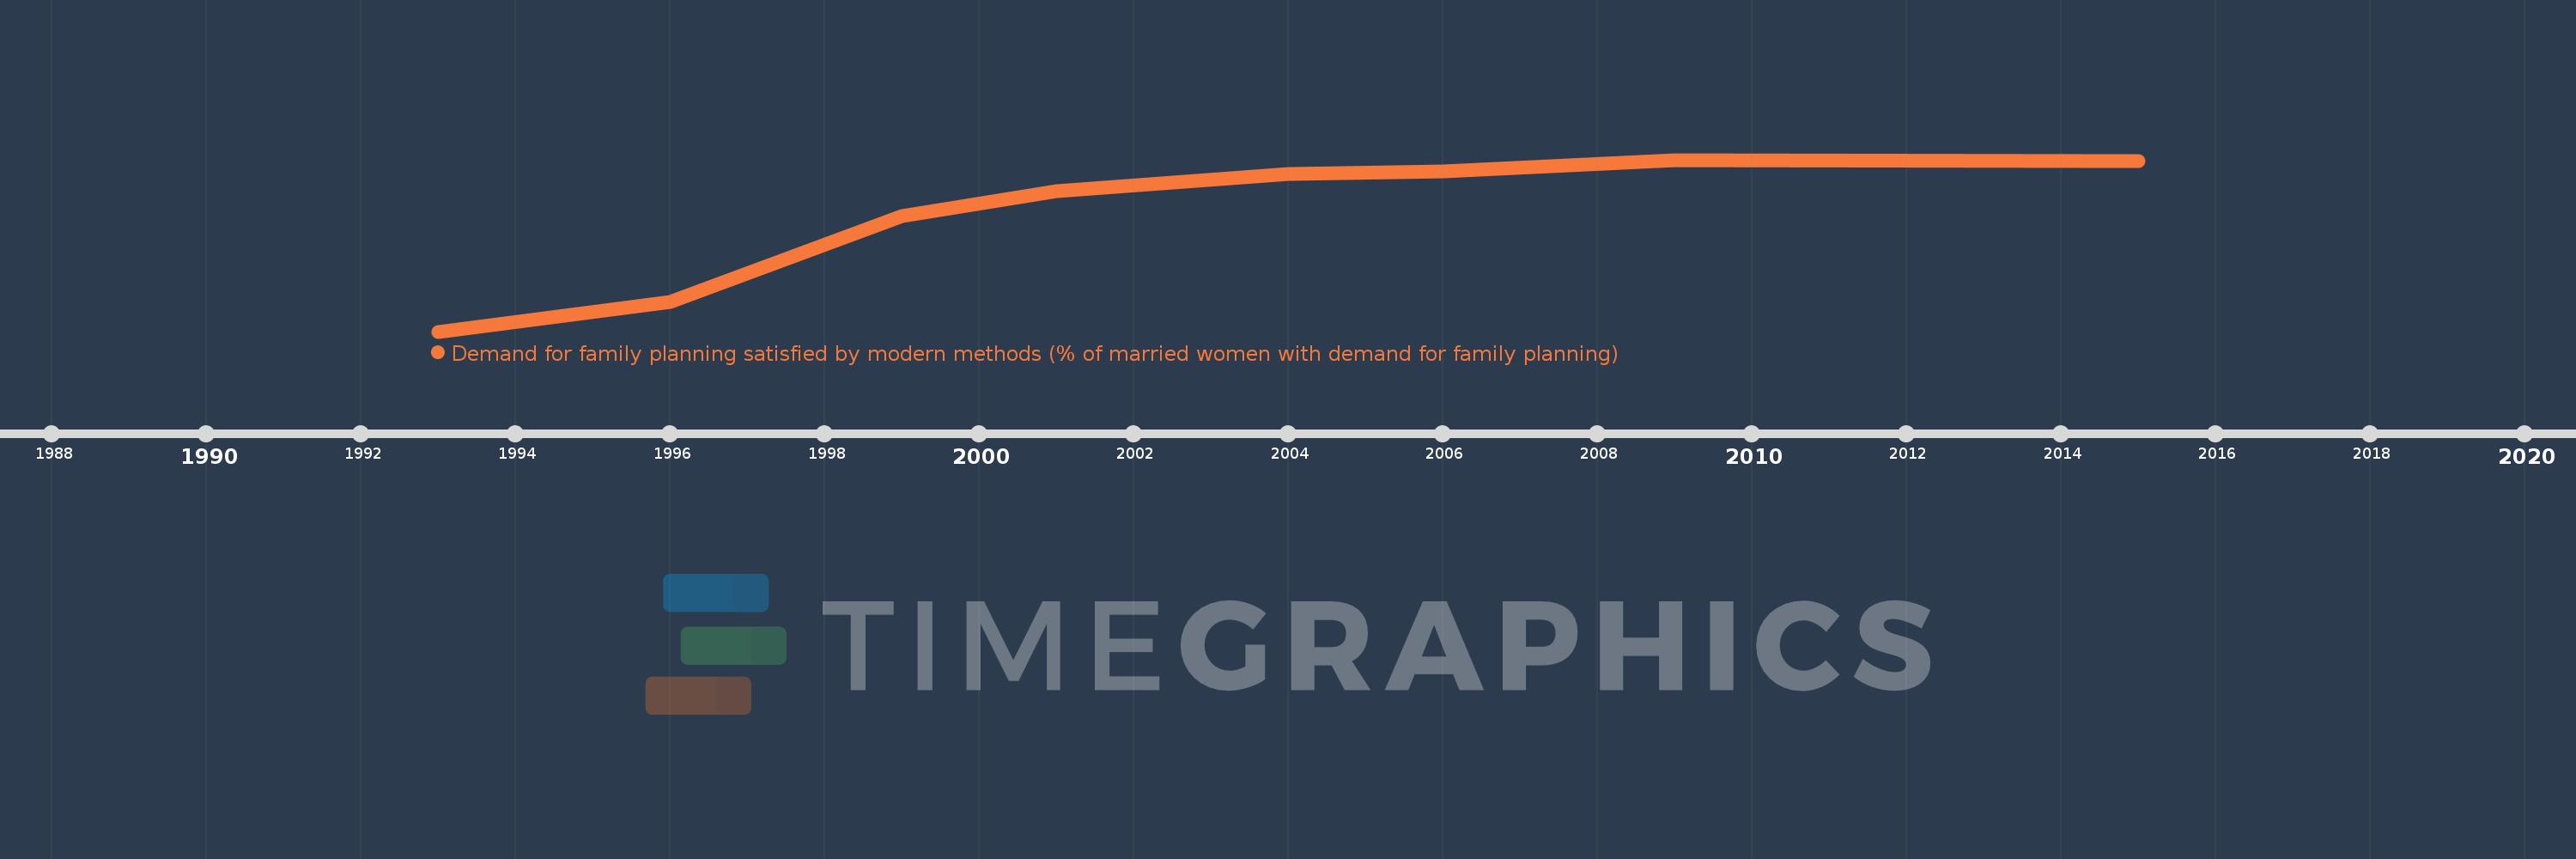
Questa scala temporale mostra un grafico dal 1993 anno al 2015 anno. Egypt, Arab Rep.. I dati fino ad 1992 anno non disponibili. Il numero di osservazioni attuali secondo i date: 8.
La fonte (nome):
Indicatori dello sviluppo mondiale
La fonte (organizzazione):
Demographic and Health Surveys (DHS).
Categorie:
Health
sono stati aggiornati
23 apr 2017 anni
Indicatori delle variazioni dei valori per anni
In media:
75.088
Minima:
64.0
1 gen 1993 anni
Massimo:
80.1
1 gen 2009 anni
Alla data di osservazione
Valore
Variazione assoluta
La variazione rispetto al valore precedente
1 gen 1993 anni
64.0
+64.0
0.0%
1 gen 1996 anni
66.8
+2.8
4.37%
1 gen 1999 anni
74.8
+8.0
11.98%
1 gen 2001 anni
77.2
+2.4
3.21%
1 gen 2004 anni
78.8
+1.6
2.07%
1 gen 2006 anni
79.0
+0.2
0.25%
1 gen 2009 anni
80.1
+1.1
1.39%
1 gen 2015 anni
80.0
-0.1
-0.12%
Classificazione dei paesi secondo i statistiche attuali per anni