33
/it/
AIzaSyAYiBZKx7MnpbEhh9jyipgxe19OcubqV5w
August 1, 2025
219172
Panama
PAN
true
2
1
Trained teachers in preprimary education (% of total teachers)
2014,2013,2012,2011,2010,2009,2008,2007,2006,2005,2003,2002,2001,2000
Download
Biblioteca di statistiche globali →Panama →

Trained teachers in preprimary education (% of total teachers)

Queste statistiche in altri paesi:

AndorraAngolaAntigua and BarbudaArab WorldArmeniaArubaAzerbaijanBahamas, TheBahrainBarbadosBelarusBelizeBeninBermudaBhutanBoliviaBotswanaBritish Virgin IslandsBrunei DarussalamBurkina FasoBurundiCabo VerdeCambodiaCameroonCaribbean small statesCayman IslandsChadColombiaCongo, Dem. Rep.Congo, Rep.Costa RicaCote d'IvoireCroatiaCubaDjiboutiDominicaDominican RepublicEcuadorEgypt, Arab Rep.El SalvadorEritreaEthiopiaFragile and conflict affected situationsGambia, TheGeorgiaGhanaGibraltarGrenadaGuineaGuinea-BissauGuyanaHeavily indebted poor countries (HIPC)HondurasIDA blendIDA onlyIDA totalIran, Islamic Rep.IraqKazakhstanKenyaKuwaitKyrgyz RepublicLao PDRLatin America & Caribbean Latin America & Caribbean (excluding high income)Latin America & the Caribbean (IDA & IBRD countries)Least developed countries: UN classificationLebanonLiberiaLow incomeMacao SAR, ChinaMadagascarMalaysiaMaldivesMaliMarshall IslandsMauritaniaMauritiusMexicoMiddle East & North AfricaMiddle East & North Africa (excluding high income)Middle East & North Africa (IDA & IBRD countries)MoldovaMongoliaMoroccoMyanmarNamibiaNauruNepalNicaraguaNigerOmanOther small statesPacific island small statesPanamaParaguayPre-demographic dividendQatarRwandaSamoaSao Tome and PrincipeSaudi ArabiaSenegalSerbiaSeychellesSierra LeoneSmall statesSolomon IslandsSouth AfricaSouth SudanSt. Kitts and NevisSt. LuciaSt. Vincent and the GrenadinesSub-Saharan Africa Sub-Saharan Africa (excluding high income)Sub-Saharan Africa (IDA & IBRD countries)SurinameSwazilandSyrian Arab RepublicTajikistanTanzaniaTogoTongaTrinidad and TobagoTunisiaTuvaluUnited Arab EmiratesUzbekistanVanuatuVietnamWest Bank and GazaZimbabwe

Linea del tempo:

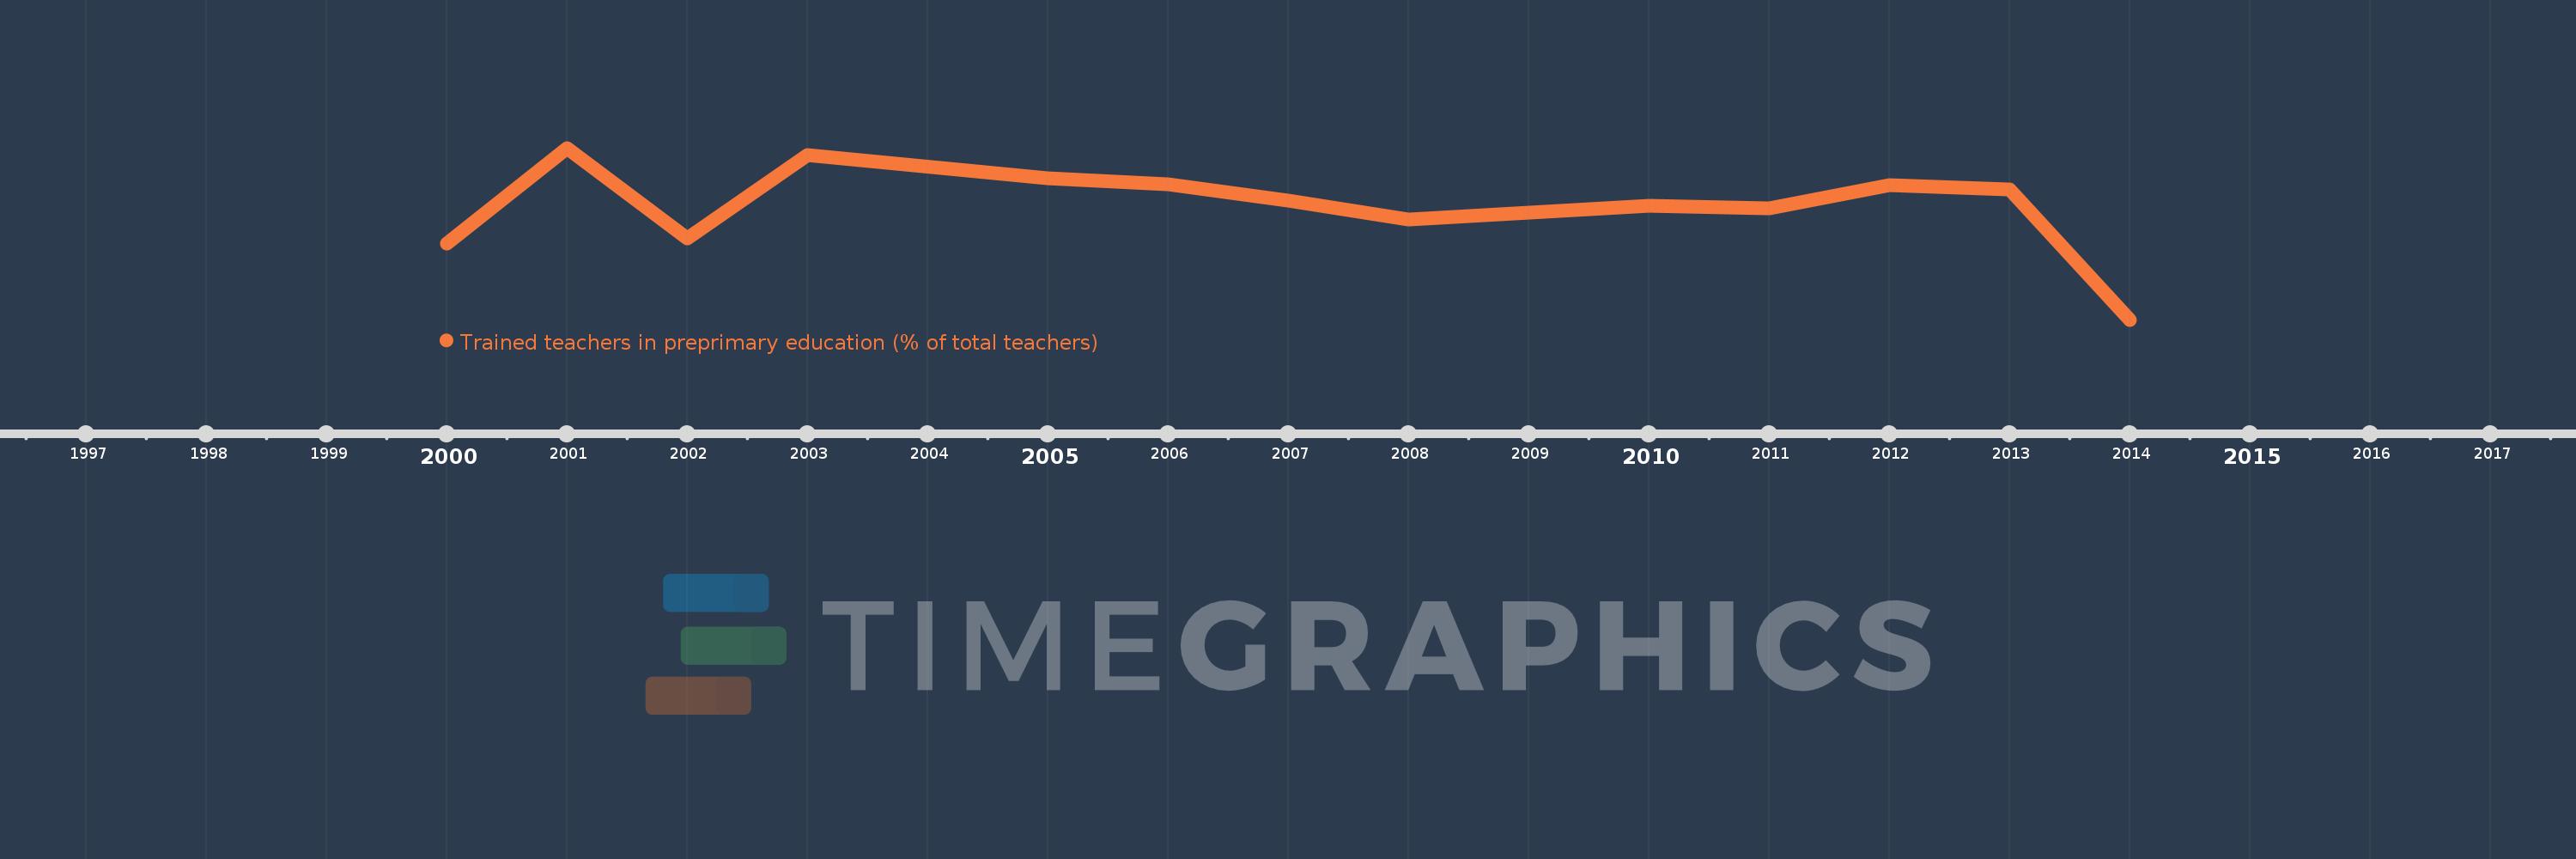
Questa scala temporale mostra un grafico dal 2000 anno al 2014 anno. Panama. I dati fino ad 1999 anno non disponibili. Il numero di osservazioni attuali secondo i date: 14.

La fonte (nome):

Indicatori dello sviluppo mondiale

La fonte (organizzazione):

United Nations Educational, Scientific, and Cultural Organization (UNESCO) Institute for Statistics.

Categorie:

Education

sono stati aggiornati

23 apr 2017 anni

Indicatori delle variazioni dei valori per anni

In media:
43.643
Minima:
21.462
1 gen 2014 anni
Massimo:
55.03
1 gen 2001 anni
Alla data di osservazione
Valore
Variazione assoluta
La variazione rispetto al valore precedente
1 gen 2000 anni
36.413
+36.413
0.0%
1 gen 2001 anni
55.03
+18.617
51.13%
1 gen 2002 anni
37.392
-17.639
-32.05%
1 gen 2003 anni
53.676
+16.285
43.55%
1 gen 2005 anni
49.184
-4.492
-8.37%
1 gen 2006 anni
48.001
-1.183
-2.41%
1 gen 2007 anni
44.687
-3.314
-6.9%
1 gen 2008 anni
40.987
-3.7
-8.28%
1 gen 2009 anni
42.446
+1.459
3.56%
1 gen 2010 anni
43.705
+1.26
2.97%
1 gen 2011 anni
43.287
-0.418
-0.96%
1 gen 2012 anni
47.788
+4.501
10.4%
1 gen 2013 anni
46.948
-0.84
-1.76%
1 gen 2014 anni
21.462
-25.485
-54.28%

Classificazione dei paesi secondo i statistiche attuali per anni