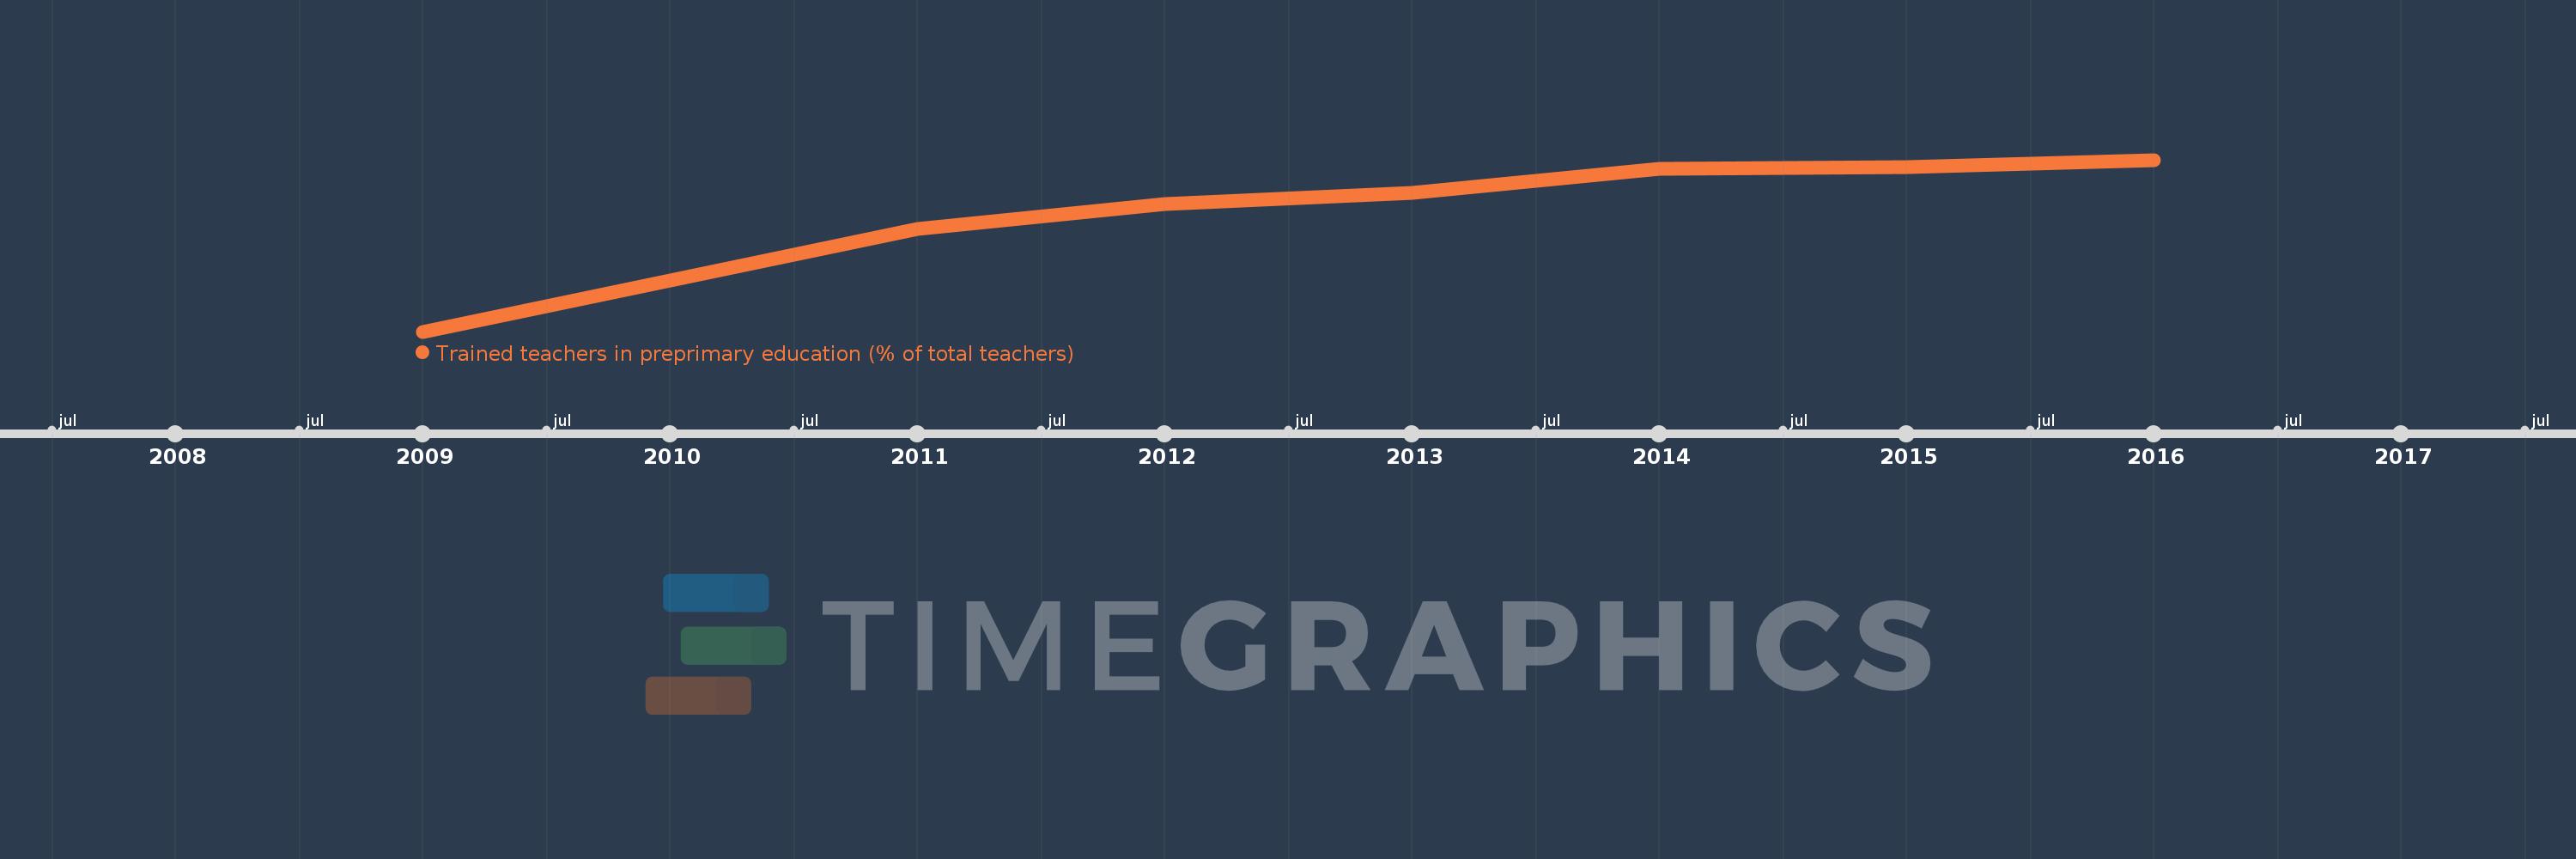
Questa scala temporale mostra un grafico dal 2009 anno al 2016 anno. Nepal. I dati fino ad 2008 anno non disponibili. Il numero di osservazioni attuali secondo i date: 7.
La fonte (nome):
Indicatori dello sviluppo mondiale
La fonte (organizzazione):
United Nations Educational, Scientific, and Cultural Organization (UNESCO) Institute for Statistics.
Categorie:
Education
sono stati aggiornati
23 apr 2017 anni
Indicatori delle variazioni dei valori per anni
In media:
83.376
Minima:
72.647
1 gen 2009 anni
Massimo:
87.51
1 gen 2016 anni
Alla data di osservazione
Valore
Variazione assoluta
La variazione rispetto al valore precedente
1 gen 2009 anni
72.647
+72.647
0.0%
1 gen 2011 anni
81.549
+8.901
12.25%
1 gen 2012 anni
83.697
+2.148
2.63%
1 gen 2013 anni
84.655
+0.958
1.15%
1 gen 2014 anni
86.701
+2.045
2.42%
1 gen 2015 anni
86.874
+0.174
0.2%
1 gen 2016 anni
87.51
+0.636
0.73%
Classificazione dei paesi secondo i statistiche attuali per anni