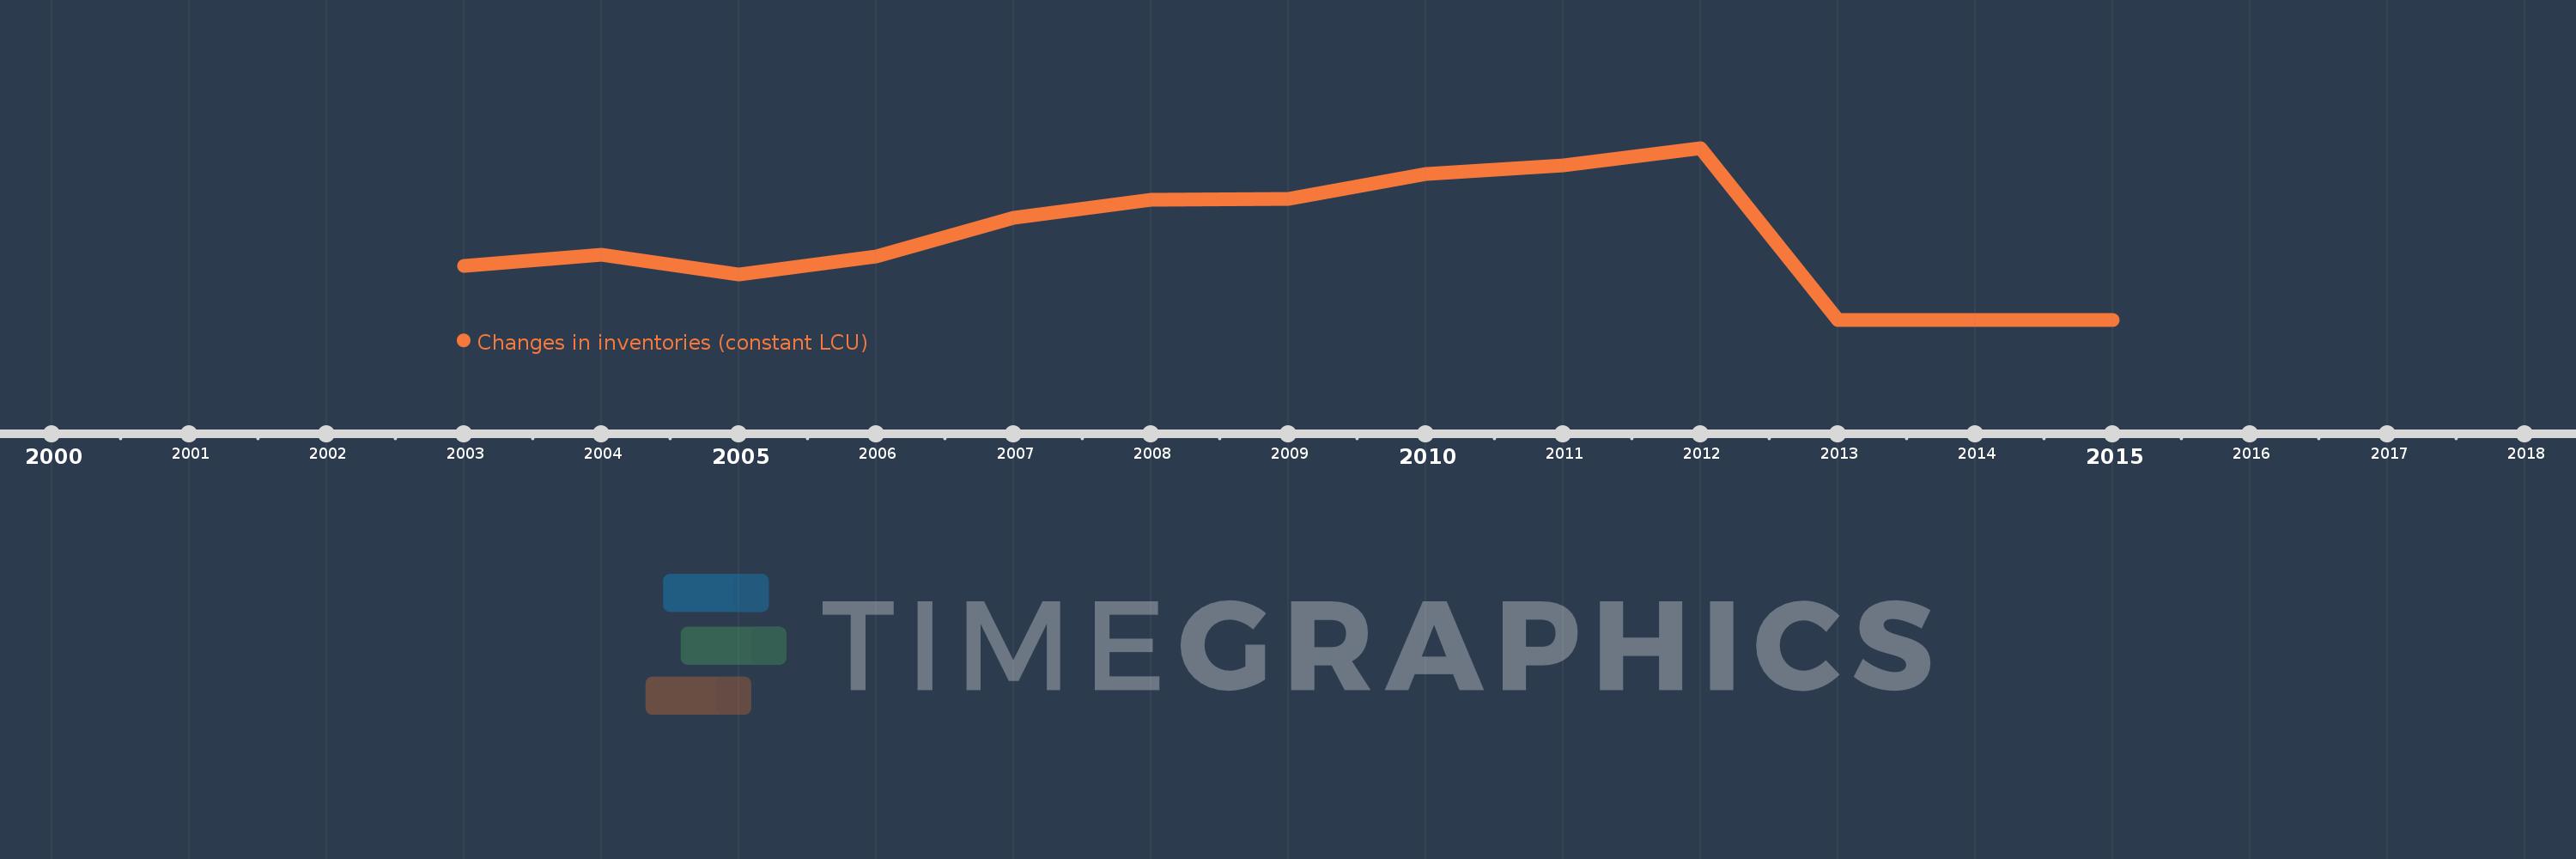
Questa scala temporale mostra un grafico dal 2003 anno al 2015 anno. Malawi. I dati fino ad 2002 anno non disponibili. Il numero di osservazioni attuali secondo i date: 13.
La fonte (nome):
Indicatori dello sviluppo mondiale
La fonte (organizzazione):
World Bank national accounts data, and OECD National Accounts data files.
Categorie:
Economy & Growth
sono stati aggiornati
23 apr 2017 anni
Indicatori delle variazioni dei valori per anni
In media:
9.835 Mlrd
Minima:
0.0
1 gen 2013 anni
Massimo:
21.102 Mlrd
1 gen 2012 anni
Alla data di osservazione
Valore
Variazione assoluta
La variazione rispetto al valore precedente
1 gen 2003 anni
6.636 Mlrd
+6.636 Mlrd
0.0%
1 gen 2004 anni
7.942 Mlrd
+1.307 Mlrd
19.69%
1 gen 2005 anni
5.568 Mlrd
-2.374 Mlrd
-29.89%
1 gen 2006 anni
7.741 Mlrd
+2.172 Mlrd
39.01%
1 gen 2007 anni
12.479 Mlrd
+4.738 Mlrd
61.21%
1 gen 2008 anni
14.702 Mlrd
+2.223 Mlrd
17.81%
1 gen 2009 anni
14.83 Mlrd
+128.28 Mln
0.87%
1 gen 2010 anni
17.923 Mlrd
+3.093 Mlrd
20.86%
1 gen 2011 anni
18.935 Mlrd
+1.011 Mlrd
5.64%
1 gen 2012 anni
21.102 Mlrd
+2.168 Mlrd
11.45%
1 gen 2013 anni
0.0
-21.102 Mlrd
-100.0%
1 gen 2014 anni
0.0
0.0
%
1 gen 2015 anni
0.0
0.0
%
Classificazione dei paesi secondo i statistiche attuali per anni