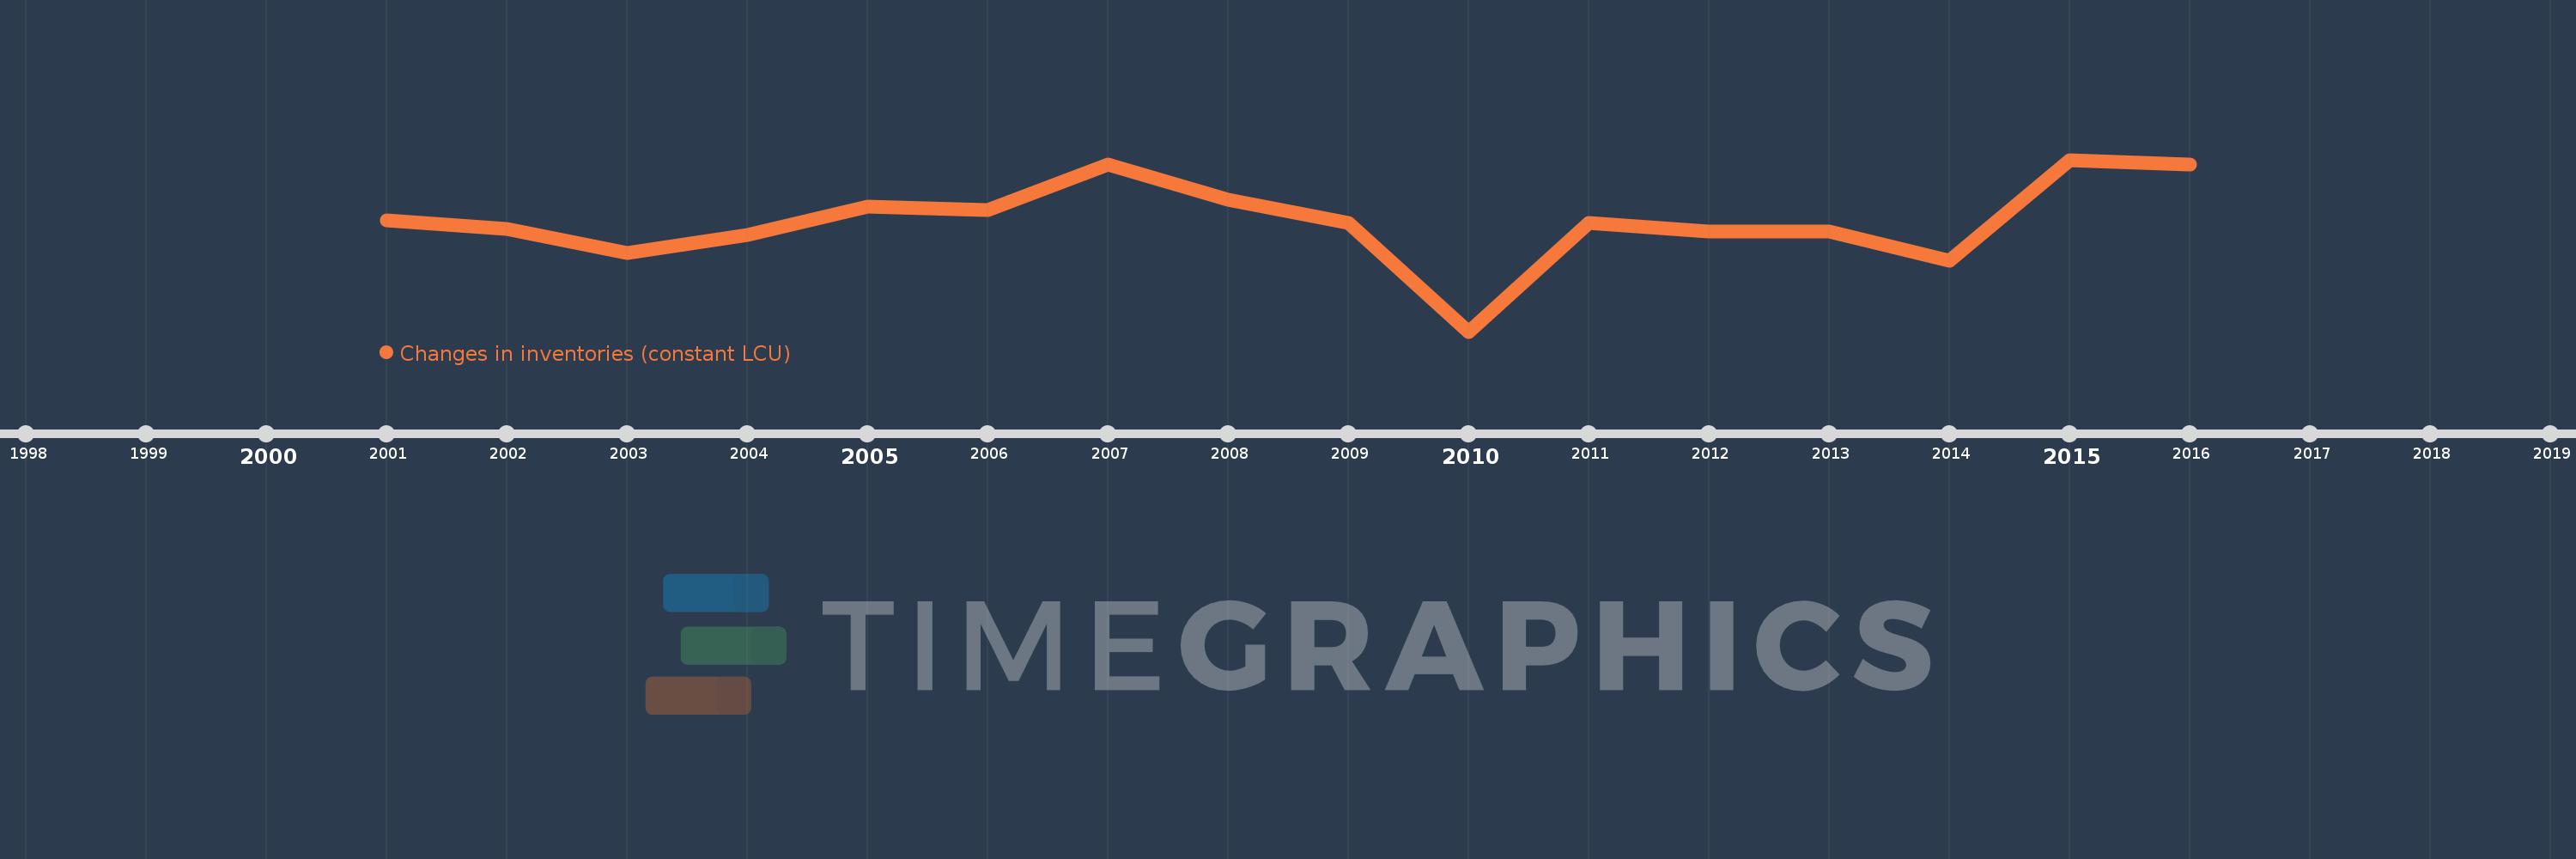
Questa scala temporale mostra un grafico dal 2001 anno al 2016 anno. Colombia. I dati fino ad 2000 anno non disponibili. Il numero di osservazioni attuali secondo i date: 16.
La fonte (nome):
Indicatori dello sviluppo mondiale
La fonte (organizzazione):
World Bank national accounts data, and OECD National Accounts data files.
Categorie:
Economy & Growth
sono stati aggiornati
23 apr 2017 anni
Indicatori delle variazioni dei valori per anni
In media:
1.596 Trln
Minima:
-1.129 Trln
1 gen 2010 anni
Massimo:
3.125 Trln
1 gen 2015 anni
Alla data di osservazione
Valore
Variazione assoluta
La variazione rispetto al valore precedente
1 gen 2001 anni
1.616 Trln
+1.616 Trln
0.0%
1 gen 2002 anni
1.406 Trln
-210.0 Mlrd
-13.0%
1 gen 2003 anni
811.0 Mlrd
-595.0 Mlrd
-42.32%
1 gen 2004 anni
1.258 Trln
+447.0 Mlrd
55.12%
1 gen 2005 anni
1.97 Trln
+712.0 Mlrd
56.6%
1 gen 2006 anni
1.889 Trln
-81.0 Mlrd
-4.11%
1 gen 2007 anni
2.999 Trln
+1.11 Trln
58.76%
1 gen 2008 anni
2.13 Trln
-869.0 Mlrd
-28.98%
1 gen 2009 anni
1.557 Trln
-573.0 Mlrd
-26.9%
1 gen 2010 anni
-1.129 Trln
-2.686 Trln
-172.51%
1 gen 2011 anni
1.568 Trln
+2.697 Trln
-238.88%
1 gen 2012 anni
1.34 Trln
-228.0 Mlrd
-14.54%
1 gen 2013 anni
1.352 Trln
+12.0 Mlrd
0.9%
1 gen 2014 anni
634.0 Mlrd
-718.0 Mlrd
-53.11%
1 gen 2015 anni
3.125 Trln
+2.491 Trln
392.9%
1 gen 2016 anni
3.014 Trln
-111.0 Mlrd
-3.55%
Classificazione dei paesi secondo i statistiche attuali per anni