29
/it/
it
AIzaSyAYiBZKx7MnpbEhh9jyipgxe19OcubqV5w
April 1, 2024
179775
Libya
LBY
true
2
1
Borrowers from commercial banks (per 1,000 adults)
2012,2011,2010,2009,2008,2007,2006,2005
Download
Biblioteca di statistiche globali →Libya →

Borrowers from commercial banks (per 1,000 adults)

Queste statistiche in altri paesi:
AfghanistanAlbaniaAlgeriaAngolaArab WorldArgentinaAzerbaijanBangladeshBelgiumBelizeBoliviaBosnia and HerzegovinaBotswanaBrazilBrunei DarussalamBurundiCabo VerdeCameroonCentral African RepublicCentral Europe and the BalticsChadChileChinaColombiaComorosCongo, Dem. Rep.Congo, Rep.Costa RicaCroatiaDjiboutiDominican RepublicEarly-demographic dividendEast Asia & Pacific (excluding high income)East Asia & Pacific (IDA & IBRD countries)EcuadorEgypt, Arab Rep.El SalvadorEquatorial GuineaEstoniaEthiopiaEurope & Central Asia (excluding high income)Europe & Central Asia (IDA & IBRD countries)Fragile and conflict affected situationsGabonGeorgiaGhanaGuatemalaGuineaHaitiHeavily indebted poor countries (HIPC)HondurasHungaryIBRD onlyIDA & IBRD totalIDA blendIDA onlyIDA totalIndonesiaIsraelItalyKenyaKiribatiKosovoKuwaitKyrgyz RepublicLao PDRLate-demographic dividendLatin America & Caribbean Latin America & Caribbean (excluding high income)Latin America & the Caribbean (IDA & IBRD countries)LatviaLeast developed countries: UN classificationLebanonLesothoLiberiaLibyaLow & middle incomeLow incomeLower middle incomeMacedonia, FYRMadagascarMalawiMalaysiaMaldivesMauritaniaMiddle East & North AfricaMiddle East & North Africa (excluding high income)Middle East & North Africa (IDA & IBRD countries)Middle incomeMoldovaMontenegroMozambiqueMyanmarNamibiaNigeriaOther small statesPakistanPalauParaguayPeruPolandPortugalPre-demographic dividendQatarRomaniaRwandaSamoaSan MarinoSao Tome and PrincipeSaudi ArabiaSerbiaSeychellesSierra LeoneSingaporeSmall statesSolomon IslandsSouth AsiaSouth Asia (IDA & IBRD)South SudanSub-Saharan Africa Sub-Saharan Africa (excluding high income)Sub-Saharan Africa (IDA & IBRD countries)SurinameSwazilandSyrian Arab RepublicTajikistanTanzaniaThailandTimor-LesteTunisiaTurkeyUgandaUnited KingdomUpper middle incomeUruguayUzbekistanVanuatuWest Bank and GazaWorldYemen, Rep.ZambiaZimbabwe
Linea del tempo:
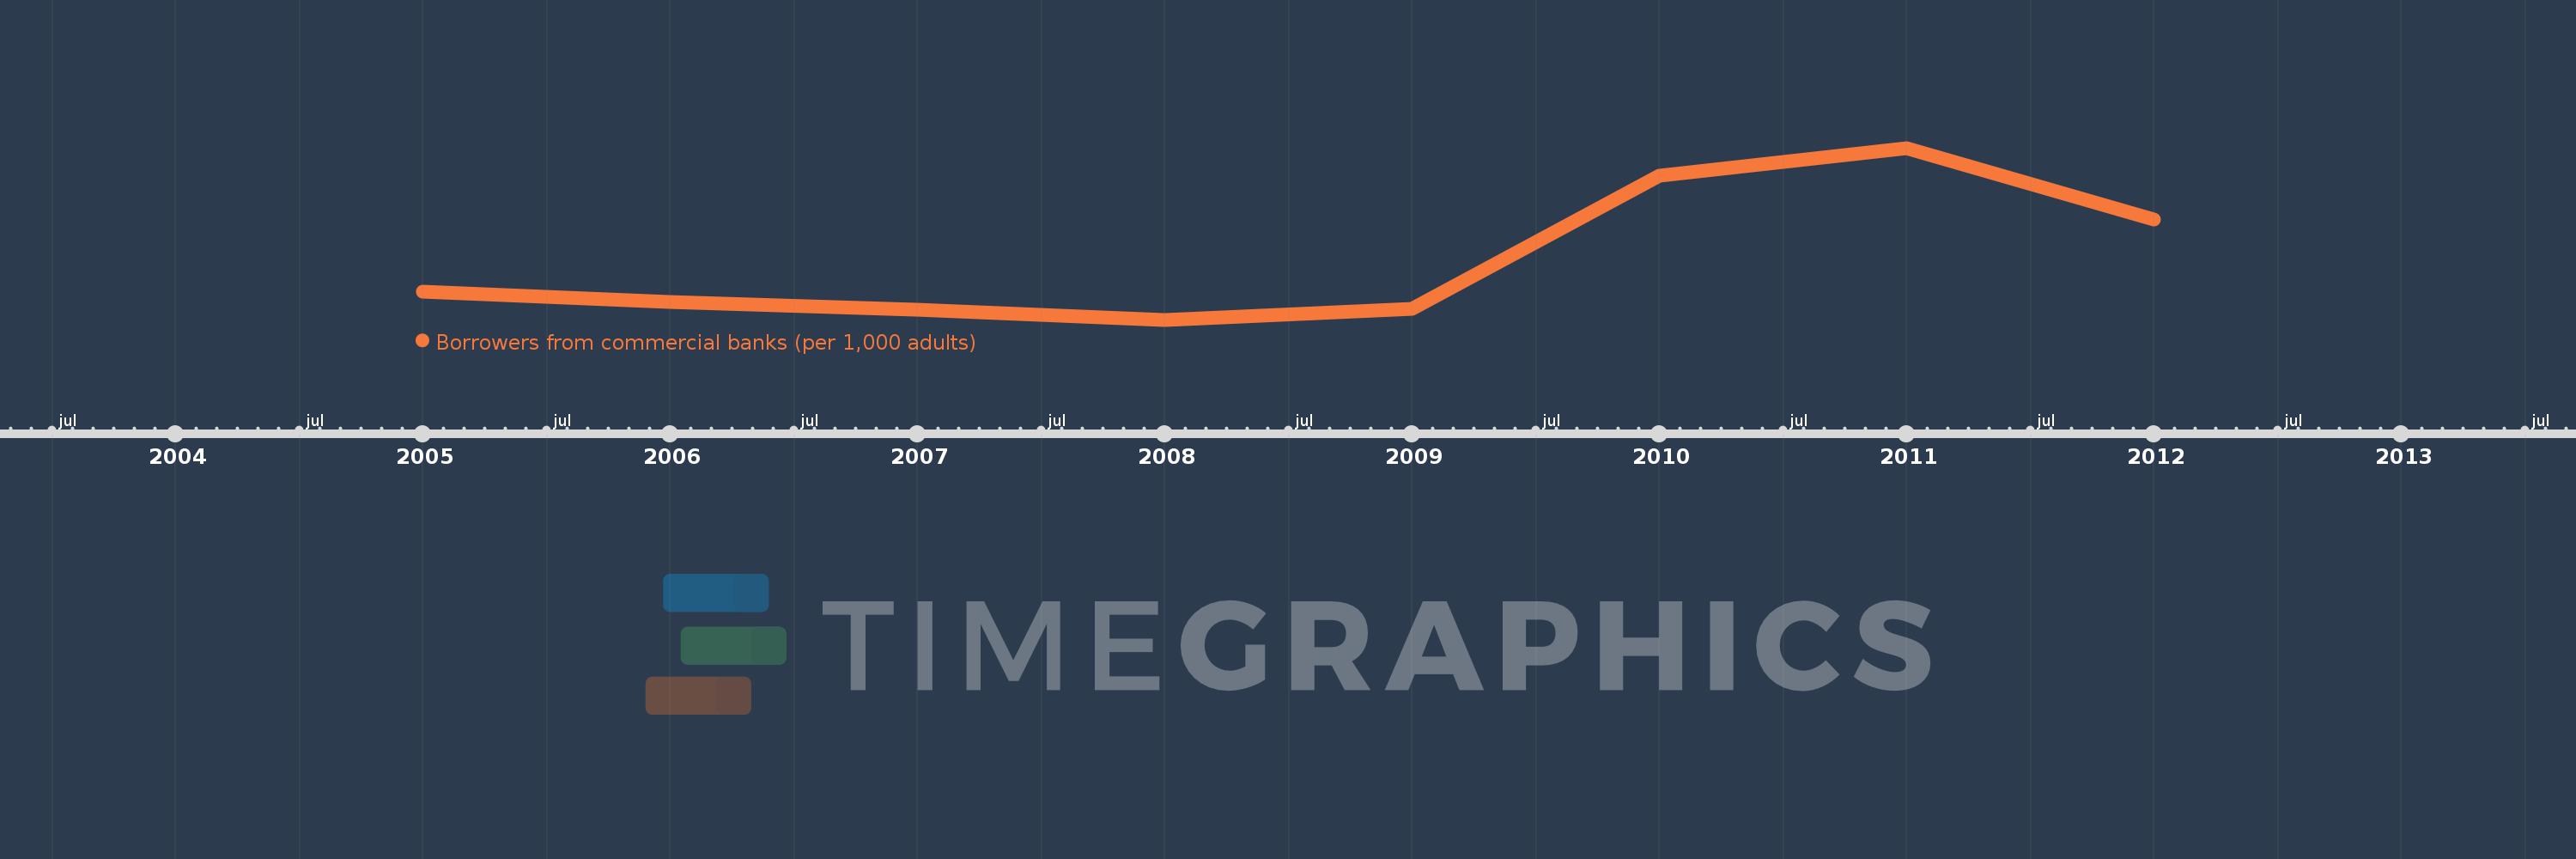
Questa scala temporale mostra un grafico dal 2005 anno al 2012 anno. Libya. I dati fino ad 2004 anno non disponibili. Il numero di osservazioni attuali secondo i date: 8.
La fonte (nome):
Indicatori dello sviluppo mondiale
La fonte (organizzazione):
International Monetary Fund, Financial Access Survey.
Categorie:
Financial Sector
sono stati aggiornati
23 apr 2017 anni
Indicatori delle variazioni dei valori per anni
In media:
126.914
Minima:
112.599
1 gen 2008 anni
Massimo:
153.389
1 gen 2011 anni
Alla data di osservazione
Valore
Variazione assoluta
La variazione rispetto al valore precedente
1 gen 2005 anni
119.187
+119.187
0.0%
1 gen 2006 anni
116.756
-2.43
-2.04%
1 gen 2007 anni
114.962
-1.794
-1.54%
1 gen 2008 anni
112.599
-2.363
-2.06%
1 gen 2009 anni
115.139
+2.541
2.26%
1 gen 2010 anni
146.824
+31.685
27.52%
1 gen 2011 anni
153.389
+6.565
4.47%
1 gen 2012 anni
136.459
-16.931
-11.04%
Classificazione dei paesi secondo i statistiche attuali per anni

Commenti:

Inviare
PremiumAbout & FeedbackAccordoPrivatezza
logo
© 2022 Selected Technologies LLC – Morgan Hill, California