33
/it/
AIzaSyAYiBZKx7MnpbEhh9jyipgxe19OcubqV5w
August 1, 2025
109368
Congo, Dem. Rep.
COD
true
2
1
Borrowers from commercial banks (per 1,000 adults)
2015,2014,2013,2012,2011,2010,2009,2008,2007,2006,2005
Download
Biblioteca di statistiche globali →Congo, Dem. Rep. →

Borrowers from commercial banks (per 1,000 adults)

Queste statistiche in altri paesi:

AfghanistanAlbaniaAlgeriaAngolaArab WorldArgentinaAzerbaijanBangladeshBelgiumBelizeBoliviaBosnia and HerzegovinaBotswanaBrazilBrunei DarussalamBurundiCabo VerdeCameroonCentral African RepublicCentral Europe and the BalticsChadChileChinaColombiaComorosCongo, Dem. Rep.Congo, Rep.Costa RicaCroatiaDjiboutiDominican RepublicEarly-demographic dividendEast Asia & Pacific (excluding high income)East Asia & Pacific (IDA & IBRD countries)EcuadorEgypt, Arab Rep.El SalvadorEquatorial GuineaEstoniaEthiopiaEurope & Central Asia (excluding high income)Europe & Central Asia (IDA & IBRD countries)Fragile and conflict affected situationsGabonGeorgiaGhanaGuatemalaGuineaHaitiHeavily indebted poor countries (HIPC)HondurasHungaryIBRD onlyIDA & IBRD totalIDA blendIDA onlyIDA totalIndonesiaIsraelItalyKenyaKiribatiKosovoKuwaitKyrgyz RepublicLao PDRLate-demographic dividendLatin America & Caribbean Latin America & Caribbean (excluding high income)Latin America & the Caribbean (IDA & IBRD countries)LatviaLeast developed countries: UN classificationLebanonLesothoLiberiaLibyaLow & middle incomeLow incomeLower middle incomeMacedonia, FYRMadagascarMalawiMalaysiaMaldivesMauritaniaMiddle East & North AfricaMiddle East & North Africa (excluding high income)Middle East & North Africa (IDA & IBRD countries)Middle incomeMoldovaMontenegroMozambiqueMyanmarNamibiaNigeriaOther small statesPakistanPalauParaguayPeruPolandPortugalPre-demographic dividendQatarRomaniaRwandaSamoaSan MarinoSao Tome and PrincipeSaudi ArabiaSerbiaSeychellesSierra LeoneSingaporeSmall statesSolomon IslandsSouth AsiaSouth Asia (IDA & IBRD)South SudanSub-Saharan Africa Sub-Saharan Africa (excluding high income)Sub-Saharan Africa (IDA & IBRD countries)SurinameSwazilandSyrian Arab RepublicTajikistanTanzaniaThailandTimor-LesteTunisiaTurkeyUgandaUnited KingdomUpper middle incomeUruguayUzbekistanVanuatuWest Bank and GazaWorldYemen, Rep.ZambiaZimbabwe

Linea del tempo:

Questa scala temporale mostra un grafico dal 2005 anno al 2015 anno. Congo, Dem. Rep.. I dati fino ad 2004 anno non disponibili. Il numero di osservazioni attuali secondo i date: 11.

La fonte (nome):

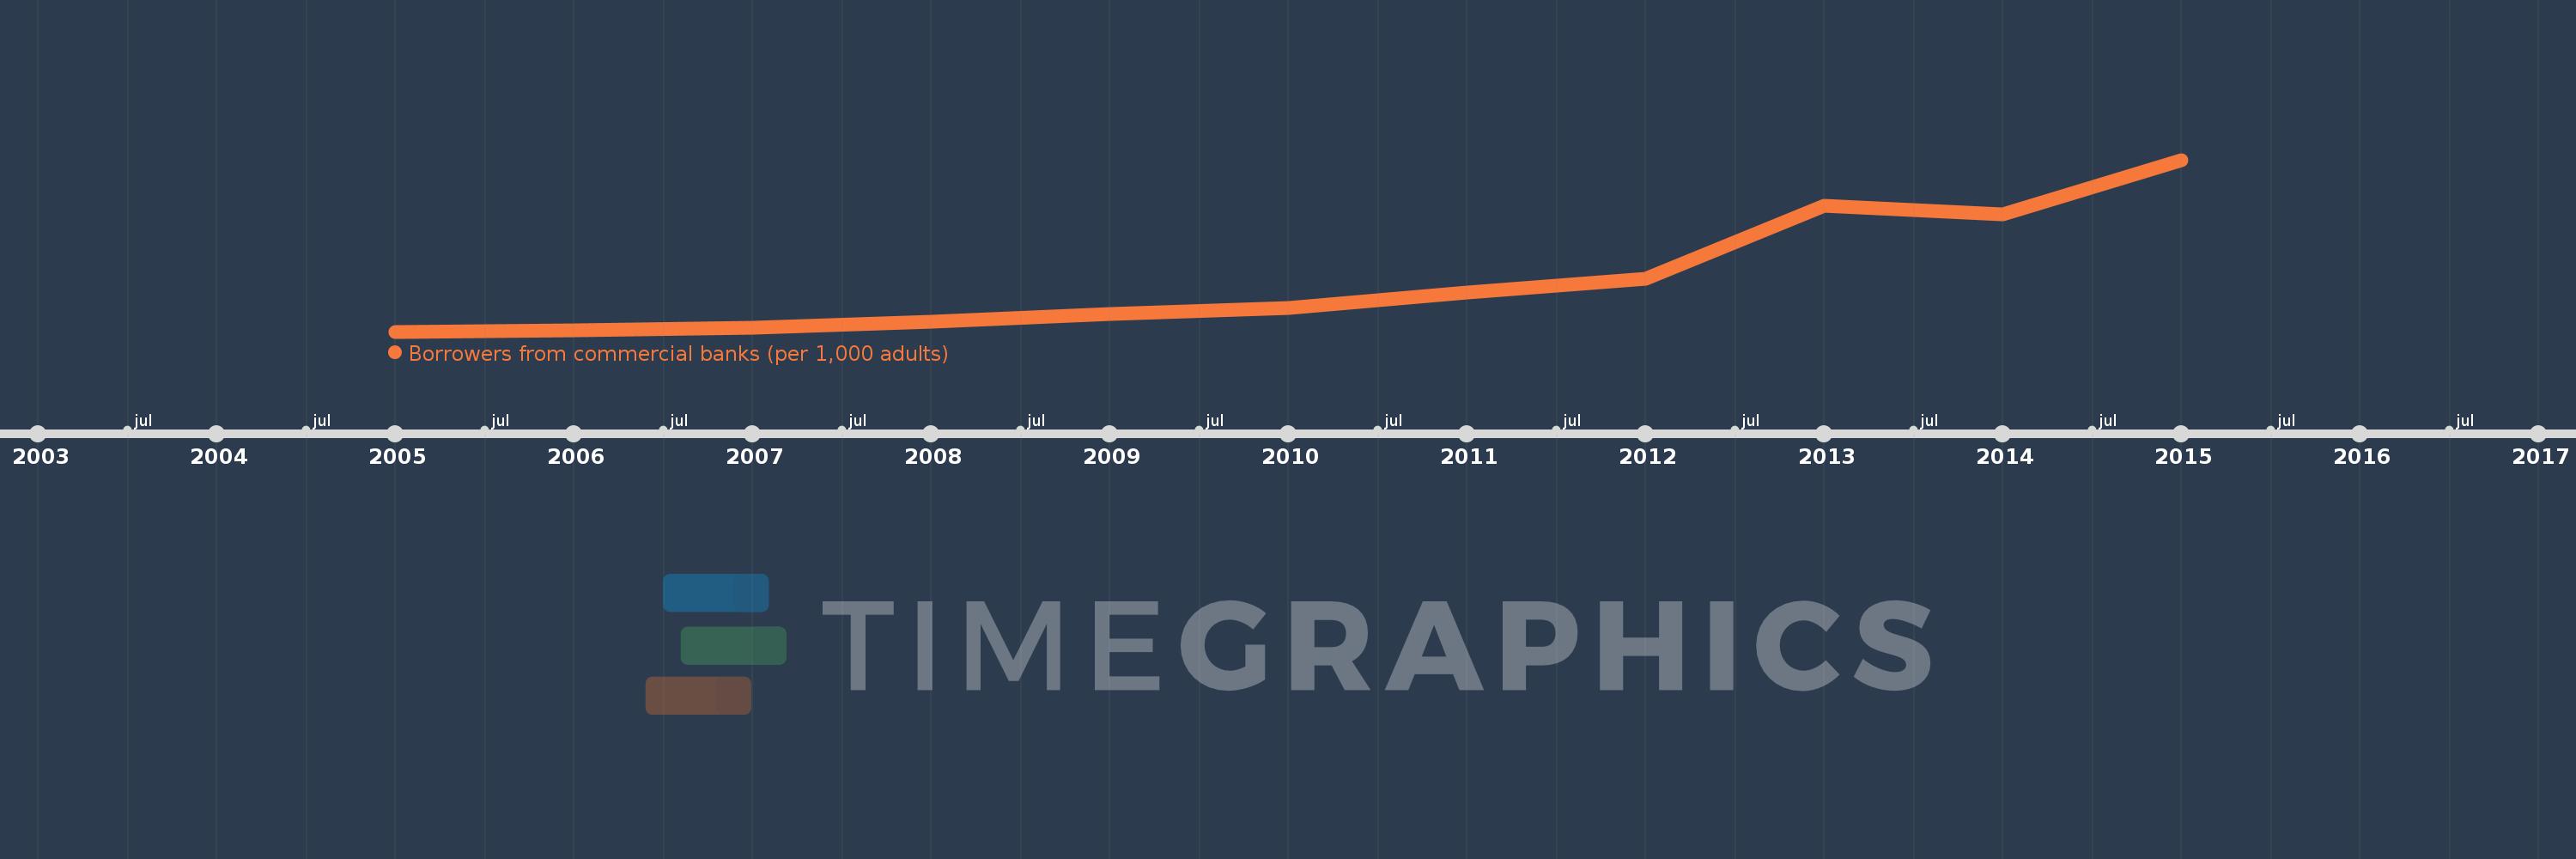
Indicatori dello sviluppo mondiale

La fonte (organizzazione):

International Monetary Fund, Financial Access Survey.

Categorie:

Financial Sector

sono stati aggiornati

23 apr 2017 anni

Indicatori delle variazioni dei valori per anni

In media:
1.404
Minima:
0.018
1 gen 2005 anni
Massimo:
4.668
1 gen 2015 anni
Alla data di osservazione
Valore
Variazione assoluta
La variazione rispetto al valore precedente
1 gen 2005 anni
0.018
+0.018
0.0%
1 gen 2006 anni
0.054
+0.036
196.1%
1 gen 2007 anni
0.127
+0.073
135.94%
1 gen 2008 anni
0.282
+0.156
122.92%
1 gen 2009 anni
0.502
+0.22
77.74%
1 gen 2010 anni
0.659
+0.157
31.29%
1 gen 2011 anni
1.081
+0.422
63.99%
1 gen 2012 anni
1.439
+0.358
33.15%
1 gen 2013 anni
3.417
+1.978
137.46%
1 gen 2014 anni
3.202
-0.215
-6.3%
1 gen 2015 anni
4.668
+1.466
45.77%

Classificazione dei paesi secondo i statistiche attuali per anni