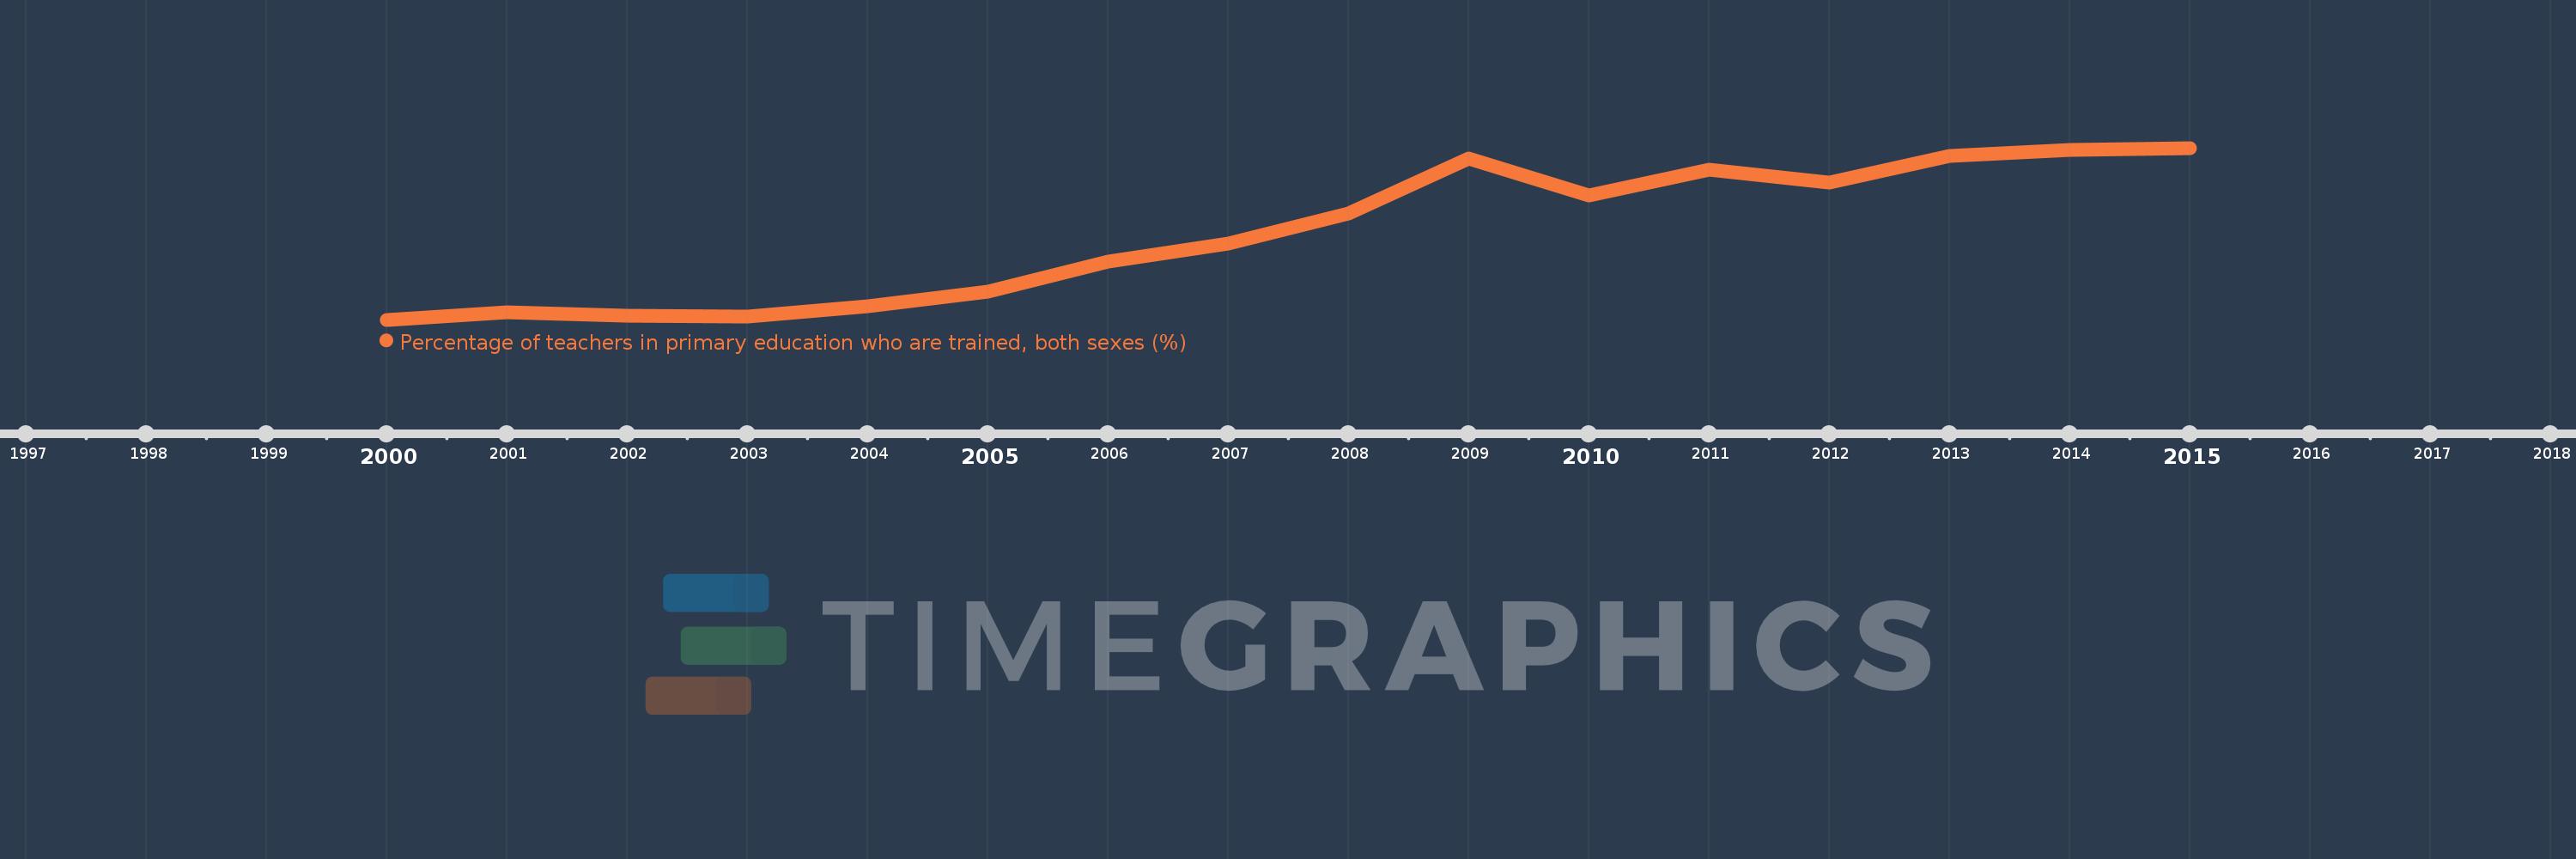
Questa scala temporale mostra un grafico dal 2000 anno al 2015 anno. Lao PDR. I dati fino ad 1999 anno non disponibili. Il numero di osservazioni attuali secondo i date: 16.
La fonte (nome):
Indicatori dello sviluppo mondiale
La fonte (organizzazione):
United Nations Educational, Scientific, and Cultural Organization (UNESCO) Institute for Statistics.
Categorie:
Education
sono stati aggiornati
23 apr 2017 anni
Indicatori delle variazioni dei valori per anni
In media:
87.002
Minima:
75.715
1 gen 2000 anni
Massimo:
98.281
1 gen 2015 anni
Alla data di osservazione
Valore
Variazione assoluta
La variazione rispetto al valore precedente
1 gen 2000 anni
75.715
+75.715
0.0%
1 gen 2001 anni
76.693
+0.977
1.29%
1 gen 2002 anni
76.241
-0.452
-0.59%
1 gen 2003 anni
76.15
-0.091
-0.12%
1 gen 2004 anni
77.523
+1.373
1.8%
1 gen 2005 anni
79.353
+1.831
2.36%
1 gen 2006 anni
83.381
+4.028
5.08%
1 gen 2007 anni
85.759
+2.378
2.85%
1 gen 2008 anni
89.67
+3.911
4.56%
1 gen 2009 anni
96.886
+7.215
8.05%
1 gen 2010 anni
91.987
-4.898
-5.06%
1 gen 2011 anni
95.403
+3.416
3.71%
1 gen 2012 anni
93.766
-1.637
-1.72%
1 gen 2013 anni
97.238
+3.472
3.7%
1 gen 2014 anni
97.98
+0.742
0.76%
1 gen 2015 anni
98.281
+0.301
0.31%
Classificazione dei paesi secondo i statistiche attuali per anni