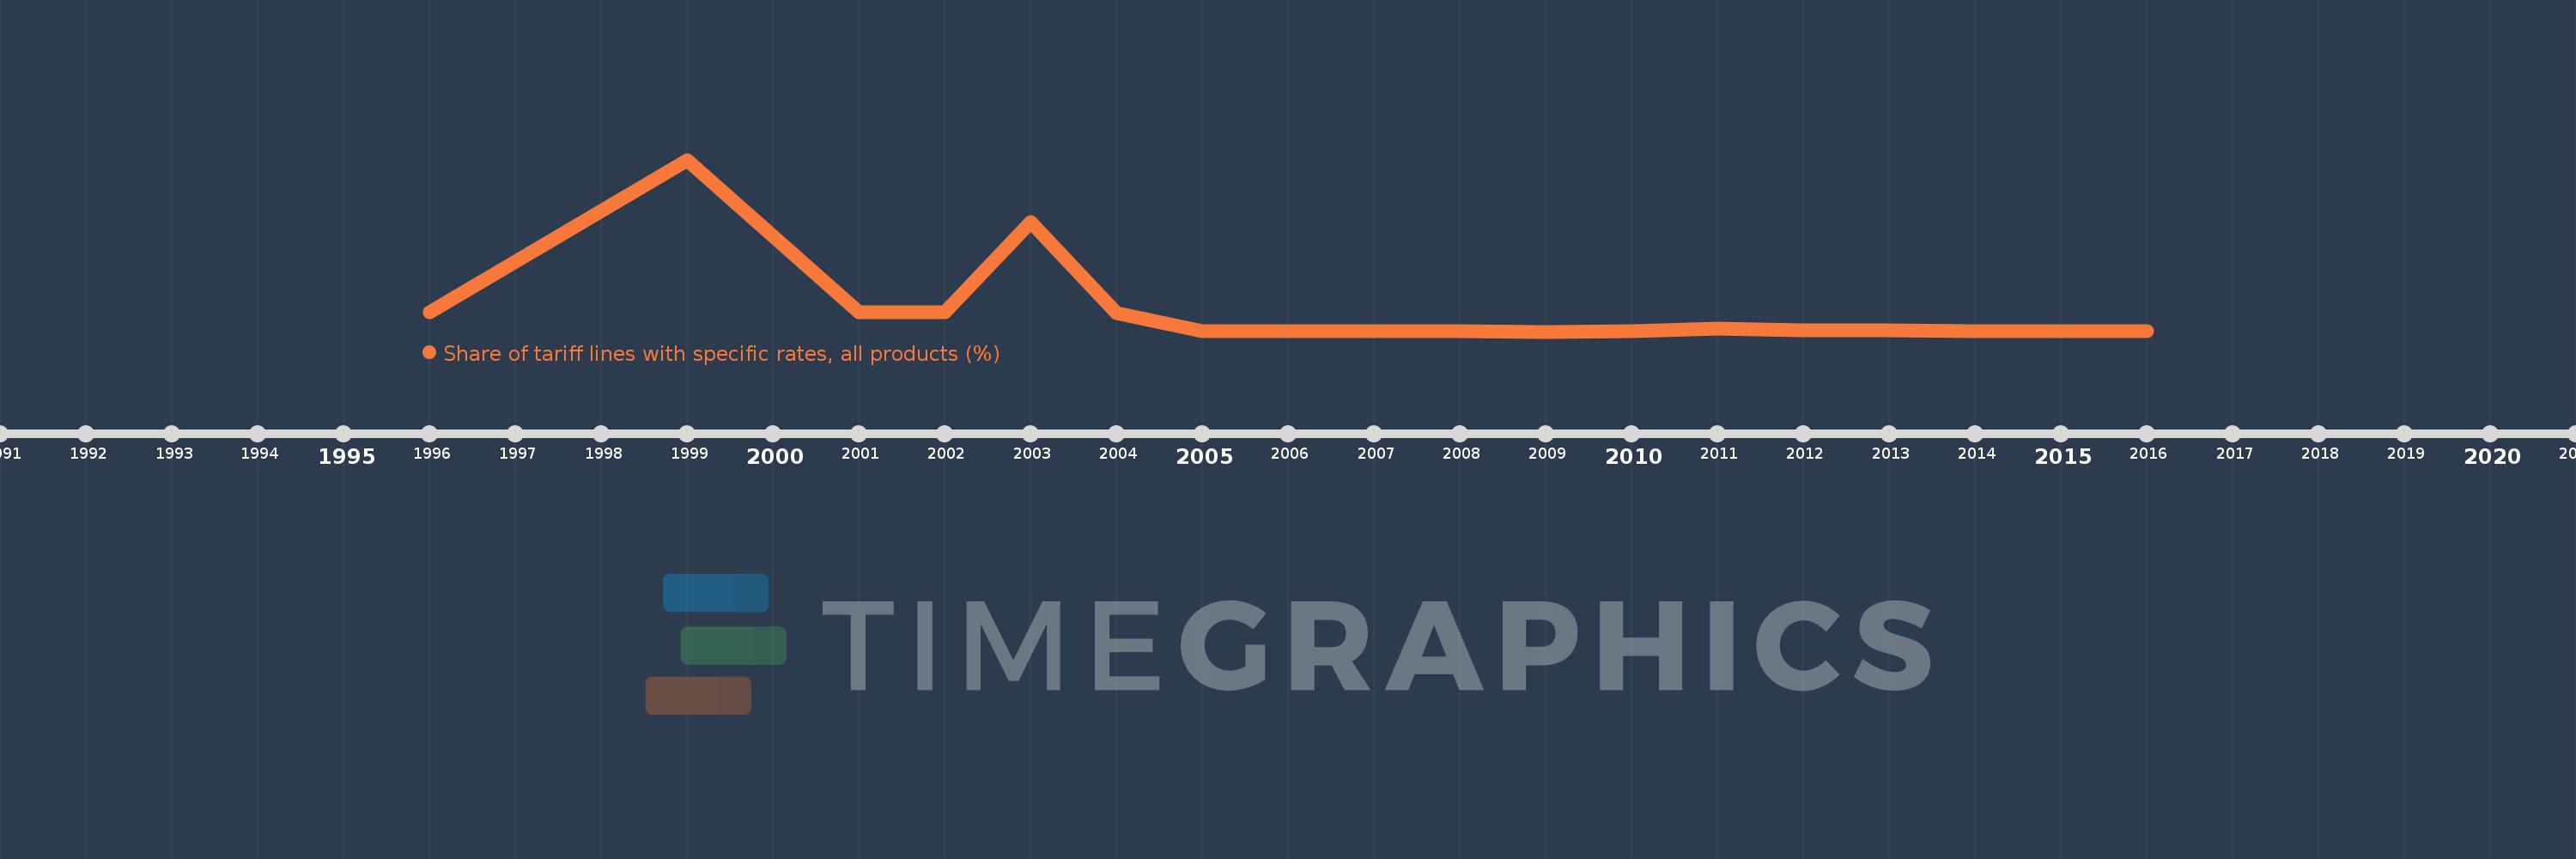
Questa scala temporale mostra un grafico dal 1996 anno al 2016 anno. Egypt, Arab Rep.. I dati fino ad 1995 anno non disponibili. Il numero di osservazioni attuali secondo i date: 18.
La fonte (nome):
Indicatori dello sviluppo mondiale
La fonte (organizzazione):
World Bank staff estimates using the World Integrated Trade Solution system, based on data from United Nations Conference on Trade and Development's Trade Analysis and Information System (TRAINS) database.
Categorie:
Private Sector, Trade
sono stati aggiornati
23 apr 2017 anni
Indicatori delle variazioni dei valori per anni
In media:
1.231
Minima:
0.153
1 gen 2009 anni
Massimo:
9.304
1 gen 1999 anni
Alla data di osservazione
Valore
Variazione assoluta
La variazione rispetto al valore precedente
1 gen 1996 anni
1.164
+1.164
0.0%
1 gen 1999 anni
9.304
+8.14
699.05%
1 gen 2001 anni
1.161
-8.144
-87.53%
1 gen 2002 anni
1.161
0.0
0.0%
1 gen 2003 anni
5.991
+4.831
416.17%
1 gen 2004 anni
1.121
-4.87
-81.29%
1 gen 2005 anni
0.18
-0.94
-83.9%
1 gen 2006 anni
0.155
-0.025
-14.04%
1 gen 2007 anni
0.183
+0.028
18.0%
1 gen 2008 anni
0.181
-0.002
-1.14%
1 gen 2009 anni
0.153
-0.028
-15.31%
1 gen 2010 anni
0.172
+0.019
12.23%
1 gen 2011 anni
0.291
+0.119
69.22%
1 gen 2012 anni
0.201
-0.09
-30.8%
1 gen 2013 anni
0.2
-0.001
-0.66%
1 gen 2014 anni
0.189
-0.011
-5.35%
1 gen 2015 anni
0.181
-0.008
-4.23%
1 gen 2016 anni
0.175
-0.006
-3.37%
Classificazione dei paesi secondo i statistiche attuali per anni