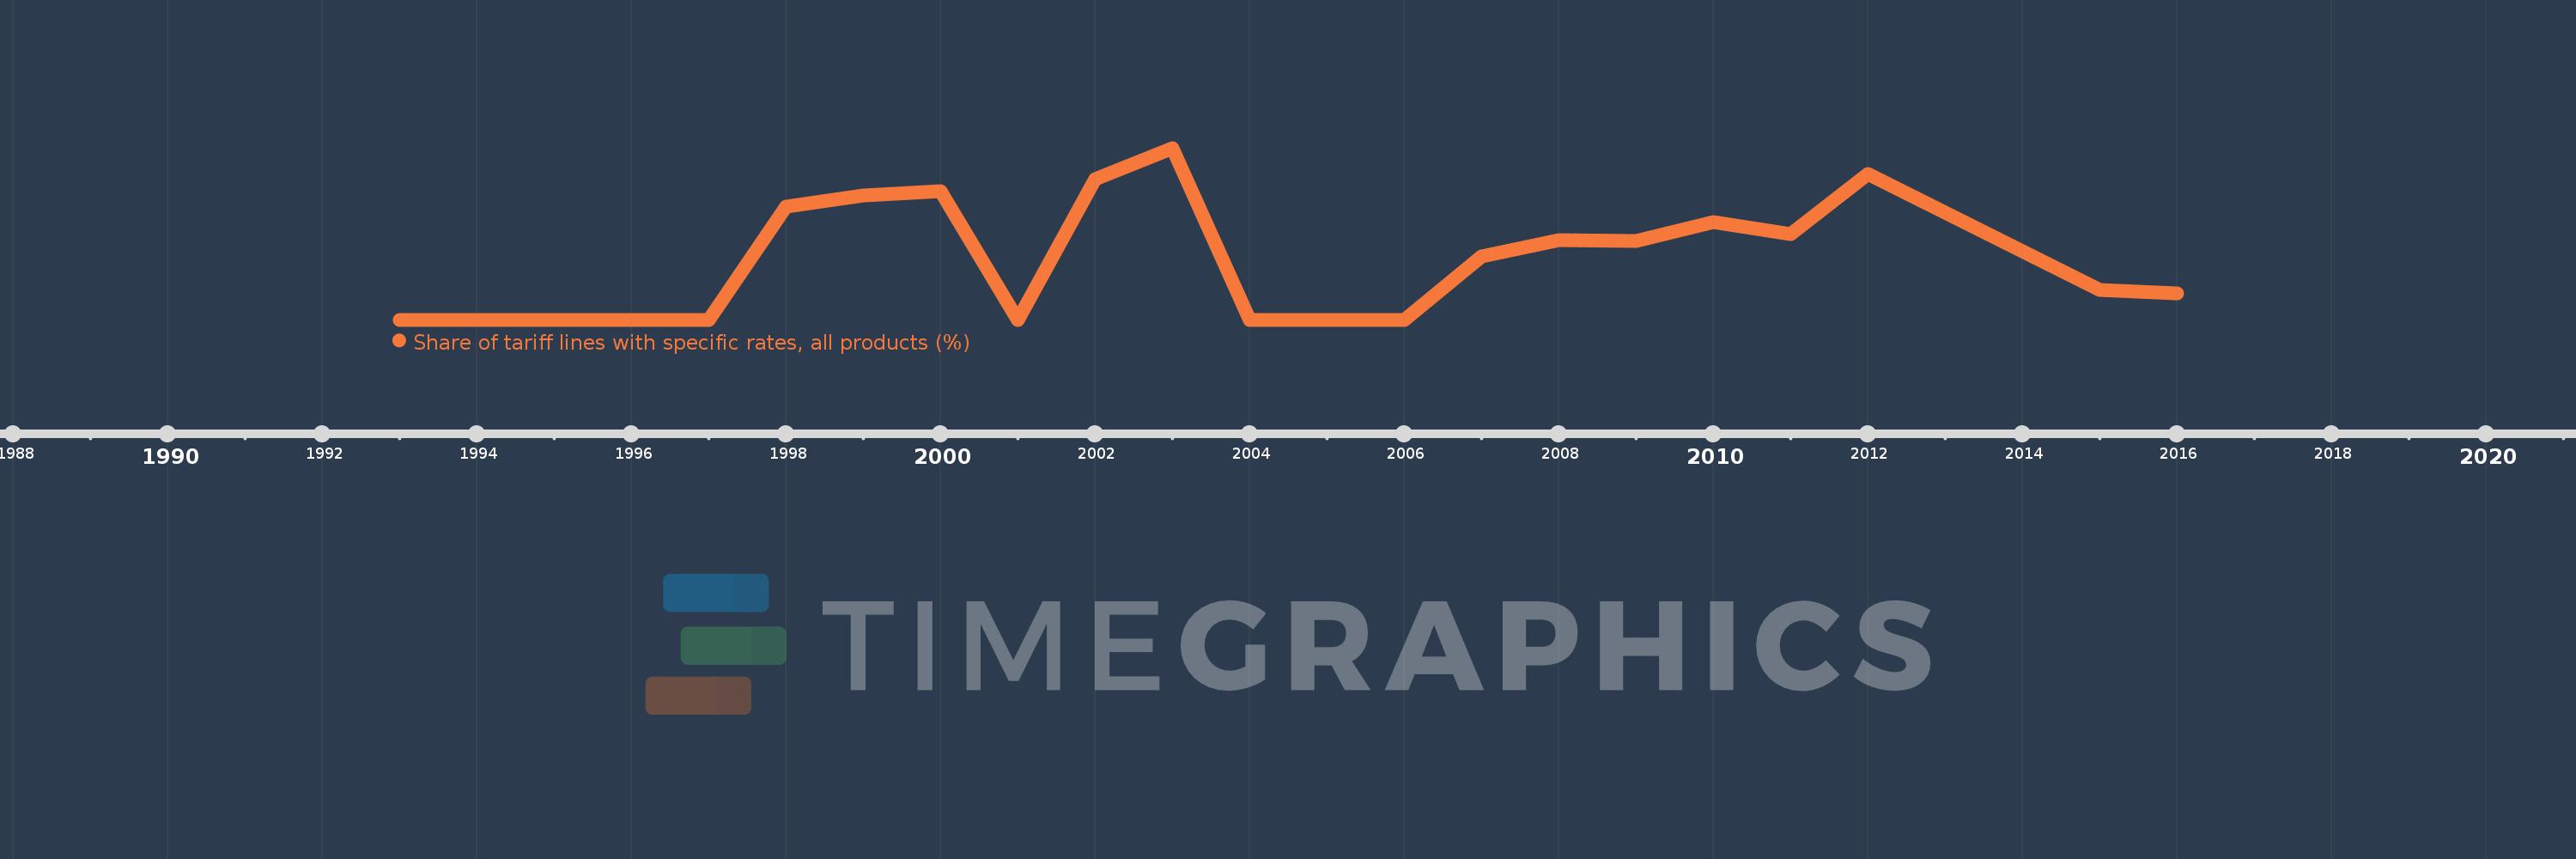
Questa scala temporale mostra un grafico dal 1993 anno al 2016 anno. China. I dati fino ad 1992 anno non disponibili. Il numero di osservazioni attuali secondo i date: 21.
La fonte (nome):
Indicatori dello sviluppo mondiale
La fonte (organizzazione):
World Bank staff estimates using the World Integrated Trade Solution system, based on data from United Nations Conference on Trade and Development's Trade Analysis and Information System (TRAINS) database.
Categorie:
Private Sector, Trade
sono stati aggiornati
23 apr 2017 anni
Indicatori delle variazioni dei valori per anni
In media:
0.205
Minima:
0.0
1 gen 1993 anni
Massimo:
0.576
1 gen 2003 anni
Alla data di osservazione
Valore
Variazione assoluta
La variazione rispetto al valore precedente
1 gen 1993 anni
0.0
0.0
0.0%
1 gen 1994 anni
0.0
0.0
%
1 gen 1995 anni
0.0
0.0
%
1 gen 1997 anni
0.0
0.0
%
1 gen 1998 anni
0.379
+0.379
%
1 gen 1999 anni
0.417
+0.038
10.03%
1 gen 2000 anni
0.432
+0.015
3.55%
1 gen 2001 anni
0.0
-0.432
-100.0%
1 gen 2002 anni
0.471
+0.471
%
1 gen 2003 anni
0.576
+0.105
22.2%
1 gen 2004 anni
0.0
-0.576
-100.0%
1 gen 2005 anni
0.0
0.0
%
1 gen 2006 anni
0.0
0.0
%
1 gen 2007 anni
0.213
+0.213
%
1 gen 2008 anni
0.266
+0.053
24.82%
1 gen 2009 anni
0.264
-0.002
-0.65%
1 gen 2010 anni
0.328
+0.064
24.16%
1 gen 2011 anni
0.287
-0.041
-12.53%
1 gen 2012 anni
0.489
+0.202
70.58%
1 gen 2015 anni
0.1
-0.389
-79.61%
1 gen 2016 anni
0.087
-0.013
-13.16%
Classificazione dei paesi secondo i statistiche attuali per anni