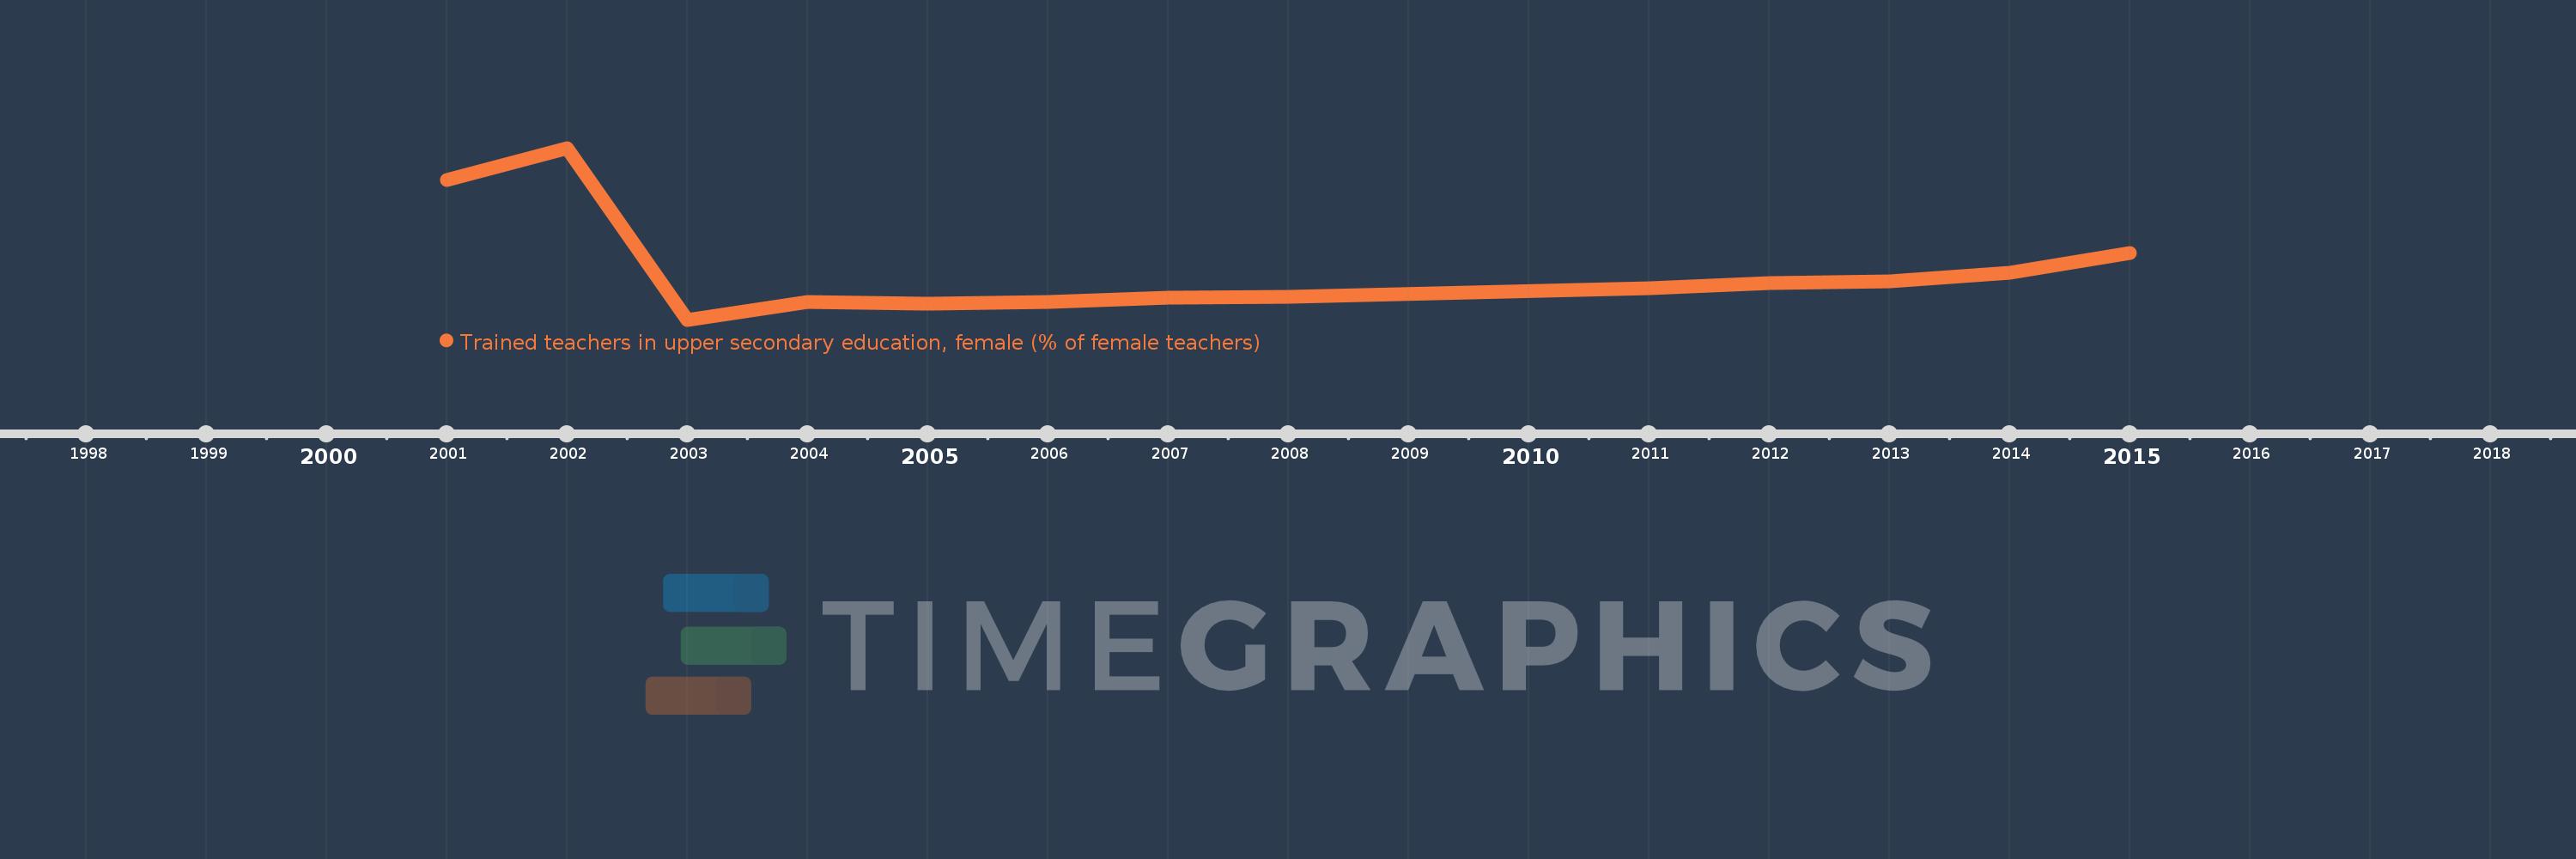
Questa scala temporale mostra un grafico dal 2001 anno al 2015 anno. Ecuador. I dati fino ad 2000 anno non disponibili. Il numero di osservazioni attuali secondo i date: 13.
La fonte (nome):
Indicatori dello sviluppo mondiale
La fonte (organizzazione):
United Nations Educational, Scientific, and Cultural Organization (UNESCO) Institute for Statistics.
Categorie:
Education
sono stati aggiornati
23 apr 2017 anni
Indicatori delle variazioni dei valori per anni
In media:
79.476
Minima:
73.984
1 gen 2003 anni
Massimo:
93.464
1 gen 2002 anni
Alla data di osservazione
Valore
Variazione assoluta
La variazione rispetto al valore precedente
1 gen 2001 anni
89.814
+89.814
0.0%
1 gen 2002 anni
93.464
+3.65
4.06%
1 gen 2003 anni
73.984
-19.481
-20.84%
1 gen 2004 anni
76.031
+2.048
2.77%
1 gen 2005 anni
75.827
-0.204
-0.27%
1 gen 2006 anni
76.004
+0.177
0.23%
1 gen 2007 anni
76.477
+0.473
0.62%
1 gen 2008 anni
76.598
+0.121
0.16%
1 gen 2011 anni
77.591
+0.993
1.3%
1 gen 2012 anni
78.126
+0.535
0.69%
1 gen 2013 anni
78.349
+0.223
0.29%
1 gen 2014 anni
79.348
+0.999
1.27%
1 gen 2015 anni
81.579
+2.231
2.81%
Classificazione dei paesi secondo i statistiche attuali per anni