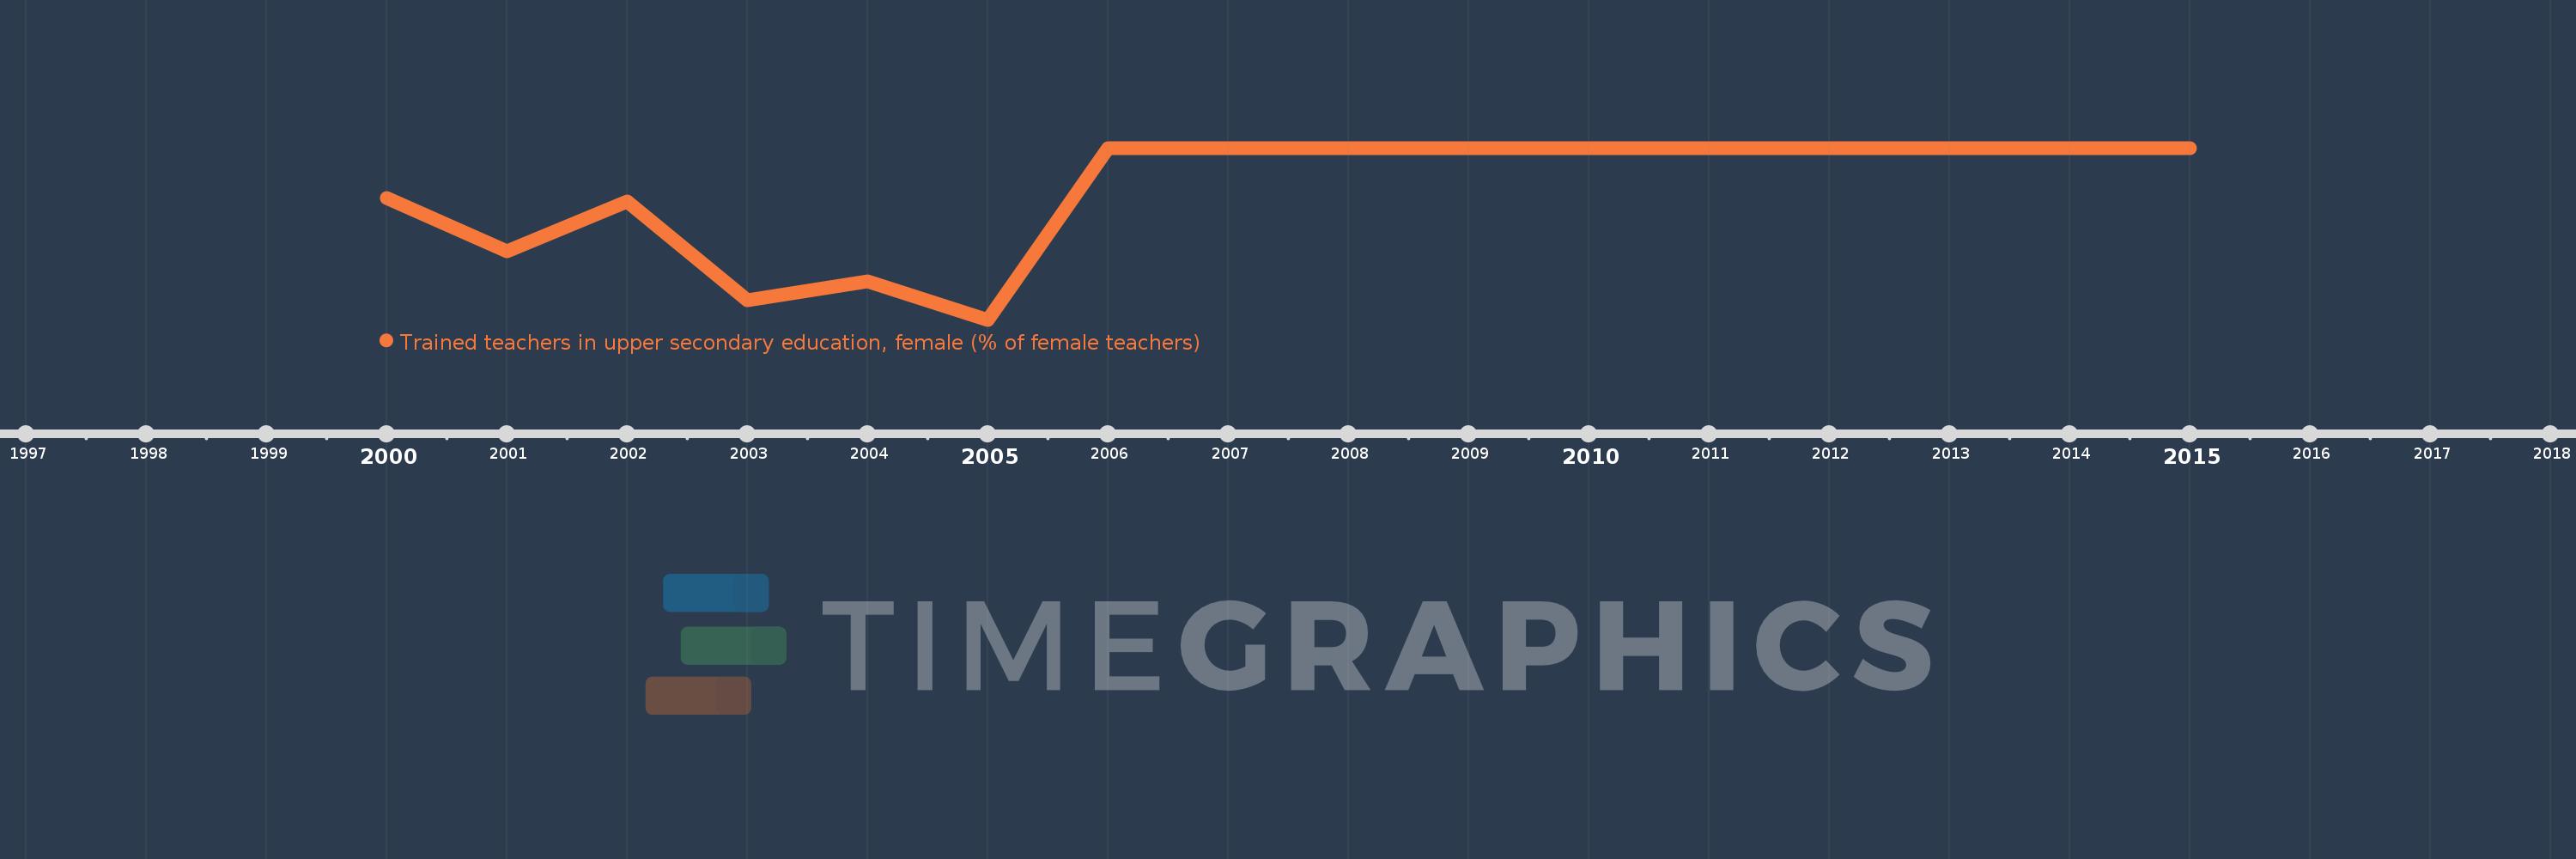
Questa scala temporale mostra un grafico dal 2000 anno al 2015 anno. Cuba. I dati fino ad 1999 anno non disponibili. Il numero di osservazioni attuali secondo i date: 16.
La fonte (nome):
Indicatori dello sviluppo mondiale
La fonte (organizzazione):
United Nations Educational, Scientific, and Cultural Organization (UNESCO) Institute for Statistics.
Categorie:
Education
sono stati aggiornati
23 apr 2017 anni
Indicatori delle variazioni dei valori per anni
In media:
95.097
Minima:
79.728
1 gen 2005 anni
Massimo:
100.0
1 gen 2006 anni
Alla data di osservazione
Valore
Variazione assoluta
La variazione rispetto al valore precedente
1 gen 2000 anni
94.054
+94.054
0.0%
1 gen 2001 anni
87.77
-6.283
-6.68%
1 gen 2002 anni
93.657
+5.887
6.71%
1 gen 2003 anni
82.04
-11.617
-12.4%
1 gen 2004 anni
84.295
+2.255
2.75%
1 gen 2005 anni
79.728
-4.567
-5.42%
1 gen 2006 anni
100.0
+20.272
25.43%
1 gen 2007 anni
100.0
0.0
0.0%
1 gen 2008 anni
100.0
0.0
0.0%
1 gen 2009 anni
100.0
0.0
0.0%
1 gen 2010 anni
100.0
0.0
0.0%
1 gen 2011 anni
100.0
0.0
0.0%
1 gen 2012 anni
100.0
0.0
0.0%
1 gen 2013 anni
100.0
0.0
0.0%
1 gen 2014 anni
100.0
0.0
0.0%
1 gen 2015 anni
100.0
0.0
0.0%
Classificazione dei paesi secondo i statistiche attuali per anni