33
/fr/
AIzaSyAYiBZKx7MnpbEhh9jyipgxe19OcubqV5w
May 1, 2025
94353
Bulgaria
BGR
true
2
1
Total reserves (% of total external debt)
2016,2015,2014,2013,2012,2011,2010,2009,2008,2007,2006,2005,2004,2003,2002,2001,2000,1999,1998,1997,1996,1995,1994,1993,1992
Download
Bibliothèque de statistiques globales →Bulgaria →

Total reserves (% of total external debt)

Cette statistique dans les autres pays:

AfghanistanAlbaniaAlgeriaAngolaArab WorldArgentinaArmeniaAzerbaijanBangladeshBelarusBelizeBeninBhutanBoliviaBosnia and HerzegovinaBotswanaBrazilBulgariaBurkina FasoBurundiCabo VerdeCambodiaCameroonCaribbean small statesCentral African RepublicCentral Europe and the BalticsChadChinaColombiaComorosCongo, Dem. Rep.Congo, Rep.Costa RicaCote d'IvoireDjiboutiDominicaDominican RepublicEarly-demographic dividendEast Asia & PacificEast Asia & Pacific (excluding high income)East Asia & Pacific (IDA & IBRD countries)EcuadorEgypt, Arab Rep.El SalvadorEritreaEthiopiaEurope & Central AsiaEurope & Central Asia (excluding high income)Europe & Central Asia (IDA & IBRD countries)FijiFragile and conflict affected situationsGabonGambia, TheGeorgiaGhanaGrenadaGuatemalaGuineaGuinea-BissauGuyanaHaitiHeavily indebted poor countries (HIPC)HondurasIBRD onlyIDA & IBRD totalIDA blendIDA onlyIDA totalIndiaIndonesiaIran, Islamic Rep.JamaicaJordanKazakhstanKenyaKosovoKyrgyz RepublicLao PDRLate-demographic dividendLatin America & Caribbean Latin America & Caribbean (excluding high income)Latin America & the Caribbean (IDA & IBRD countries)Least developed countries: UN classificationLebanonLesothoLiberiaLow & middle incomeLow incomeLower middle incomeMacedonia, FYRMadagascarMalawiMalaysiaMaldivesMaliMauritaniaMauritiusMexicoMiddle East & North AfricaMiddle East & North Africa (excluding high income)Middle East & North Africa (IDA & IBRD countries)Middle incomeMoldovaMongoliaMontenegroMoroccoMozambiqueMyanmarNepalNicaraguaNigerNigeriaOther small statesPacific island small statesPakistanPanamaPapua New GuineaParaguayPeruPhilippinesPre-demographic dividendRomaniaRussian FederationRwandaSamoaSao Tome and PrincipeSenegalSerbiaSierra LeoneSmall statesSolomon IslandsSouth AfricaSouth AsiaSouth Asia (IDA & IBRD)Sri LankaSt. LuciaSt. Vincent and the GrenadinesSub-Saharan Africa Sub-Saharan Africa (excluding high income)Sub-Saharan Africa (IDA & IBRD countries)SudanSwazilandSyrian Arab RepublicTajikistanTanzaniaThailandTogoTongaTunisiaTurkeyUgandaUkraineUpper middle incomeVanuatuVenezuela, RBVietnamYemen, Rep.ZambiaZimbabwe

La ligne de temps

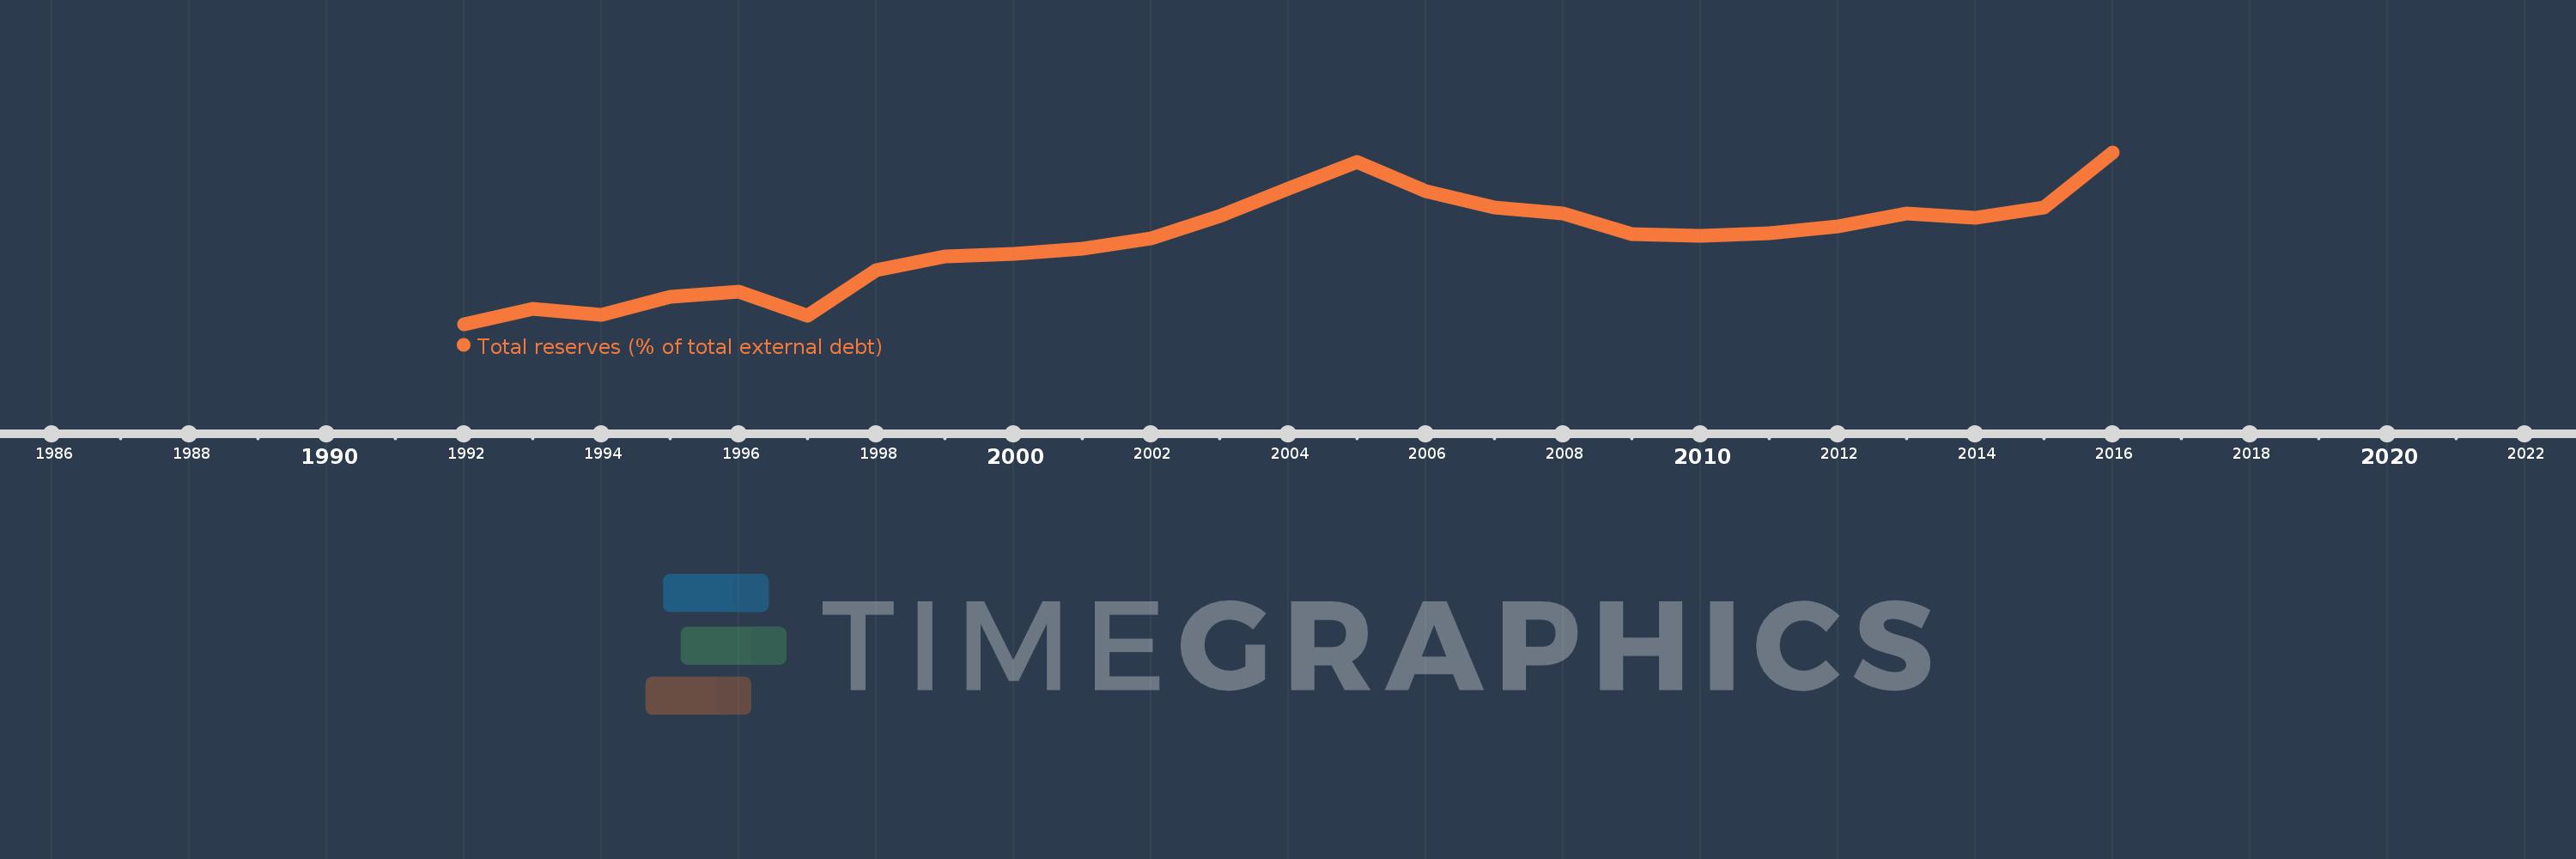
Cette échelle de temps montre un graphique de 1992 année à 2016 année Bulgaria. Les données jusqu'à 1991 année ne sont pas présentés. Quantité d'observations actuelles selon dates: 25.

Source (désignation):

Les indicateurs du développement mondiale

Source (organisation):

World Bank, International Debt Statistics.

Catégories:

Financial Sector, External Debt

Dernière mise à jour

23 avr. 2017

Les indicateurs de changement de valeurs selon les années

En moyenne:
31.643
Minimum:
5.708
1 janv. 1992
Maximum:
59.087
1 janv. 2016
Pour la date d''observation
Valeur
Changement absolu
Le changement par rapport à la valeur précédente
1 janv. 1992
5.708
+5.708
0.0%
1 janv. 1993
10.484
+4.776
83.67%
1 janv. 1994
8.642
-1.841
-17.56%
1 janv. 1995
14.213
+5.57
64.45%
1 janv. 1996
15.755
+1.542
10.85%
1 janv. 1997
8.336
-7.42
-47.09%
1 janv. 1998
22.392
+14.056
168.63%
1 janv. 1999
26.805
+4.413
19.71%
1 janv. 2000
27.679
+0.874
3.26%
1 janv. 2001
29.206
+1.527
5.52%
1 janv. 2002
32.339
+3.133
10.73%
1 janv. 2003
39.359
+7.02
21.71%
1 janv. 2004
47.867
+8.508
21.62%
1 janv. 2005
56.179
+8.312
17.36%
1 janv. 2006
46.993
-9.186
-16.35%
1 janv. 2007
41.975
-5.018
-10.68%
1 janv. 2008
40.036
-1.939
-4.62%
1 janv. 2009
33.789
-6.246
-15.6%
1 janv. 2010
33.271
-0.518
-1.53%
1 janv. 2011
34.015
+0.744
2.23%
1 janv. 2012
36.136
+2.121
6.24%
1 janv. 2013
39.983
+3.848
10.65%
1 janv. 2014
38.753
-1.23
-3.08%
1 janv. 2015
42.083
+3.329
8.59%
1 janv. 2016
59.087
+17.004
40.41%

Classement des pays selon les statistiques actuelles par années