33
/fr/
AIzaSyAYiBZKx7MnpbEhh9jyipgxe19OcubqV5w
August 1, 2025
75805
Azerbaijan
AZE
true
2
1
Total reserves (% of total external debt)
2016,2015,2014,2013,2012,2011,2010,2009,2008,2007,2006,2005,2004,2003,2002,2001,2000,1999,1998,1997,1996,1995,1994
Download
Bibliothèque de statistiques globales →Azerbaijan →

Total reserves (% of total external debt)

Cette statistique dans les autres pays:

AfghanistanAlbaniaAlgeriaAngolaArab WorldArgentinaArmeniaAzerbaijanBangladeshBelarusBelizeBeninBhutanBoliviaBosnia and HerzegovinaBotswanaBrazilBulgariaBurkina FasoBurundiCabo VerdeCambodiaCameroonCaribbean small statesCentral African RepublicCentral Europe and the BalticsChadChinaColombiaComorosCongo, Dem. Rep.Congo, Rep.Costa RicaCote d'IvoireDjiboutiDominicaDominican RepublicEarly-demographic dividendEast Asia & PacificEast Asia & Pacific (excluding high income)East Asia & Pacific (IDA & IBRD countries)EcuadorEgypt, Arab Rep.El SalvadorEritreaEthiopiaEurope & Central AsiaEurope & Central Asia (excluding high income)Europe & Central Asia (IDA & IBRD countries)FijiFragile and conflict affected situationsGabonGambia, TheGeorgiaGhanaGrenadaGuatemalaGuineaGuinea-BissauGuyanaHaitiHeavily indebted poor countries (HIPC)HondurasIBRD onlyIDA & IBRD totalIDA blendIDA onlyIDA totalIndiaIndonesiaIran, Islamic Rep.JamaicaJordanKazakhstanKenyaKosovoKyrgyz RepublicLao PDRLate-demographic dividendLatin America & Caribbean Latin America & Caribbean (excluding high income)Latin America & the Caribbean (IDA & IBRD countries)Least developed countries: UN classificationLebanonLesothoLiberiaLow & middle incomeLow incomeLower middle incomeMacedonia, FYRMadagascarMalawiMalaysiaMaldivesMaliMauritaniaMauritiusMexicoMiddle East & North AfricaMiddle East & North Africa (excluding high income)Middle East & North Africa (IDA & IBRD countries)Middle incomeMoldovaMongoliaMontenegroMoroccoMozambiqueMyanmarNepalNicaraguaNigerNigeriaOther small statesPacific island small statesPakistanPanamaPapua New GuineaParaguayPeruPhilippinesPre-demographic dividendRomaniaRussian FederationRwandaSamoaSao Tome and PrincipeSenegalSerbiaSierra LeoneSmall statesSolomon IslandsSouth AfricaSouth AsiaSouth Asia (IDA & IBRD)Sri LankaSt. LuciaSt. Vincent and the GrenadinesSub-Saharan Africa Sub-Saharan Africa (excluding high income)Sub-Saharan Africa (IDA & IBRD countries)SudanSwazilandSyrian Arab RepublicTajikistanTanzaniaThailandTogoTongaTunisiaTurkeyUgandaUkraineUpper middle incomeVanuatuVenezuela, RBVietnamYemen, Rep.ZambiaZimbabwe

La ligne de temps

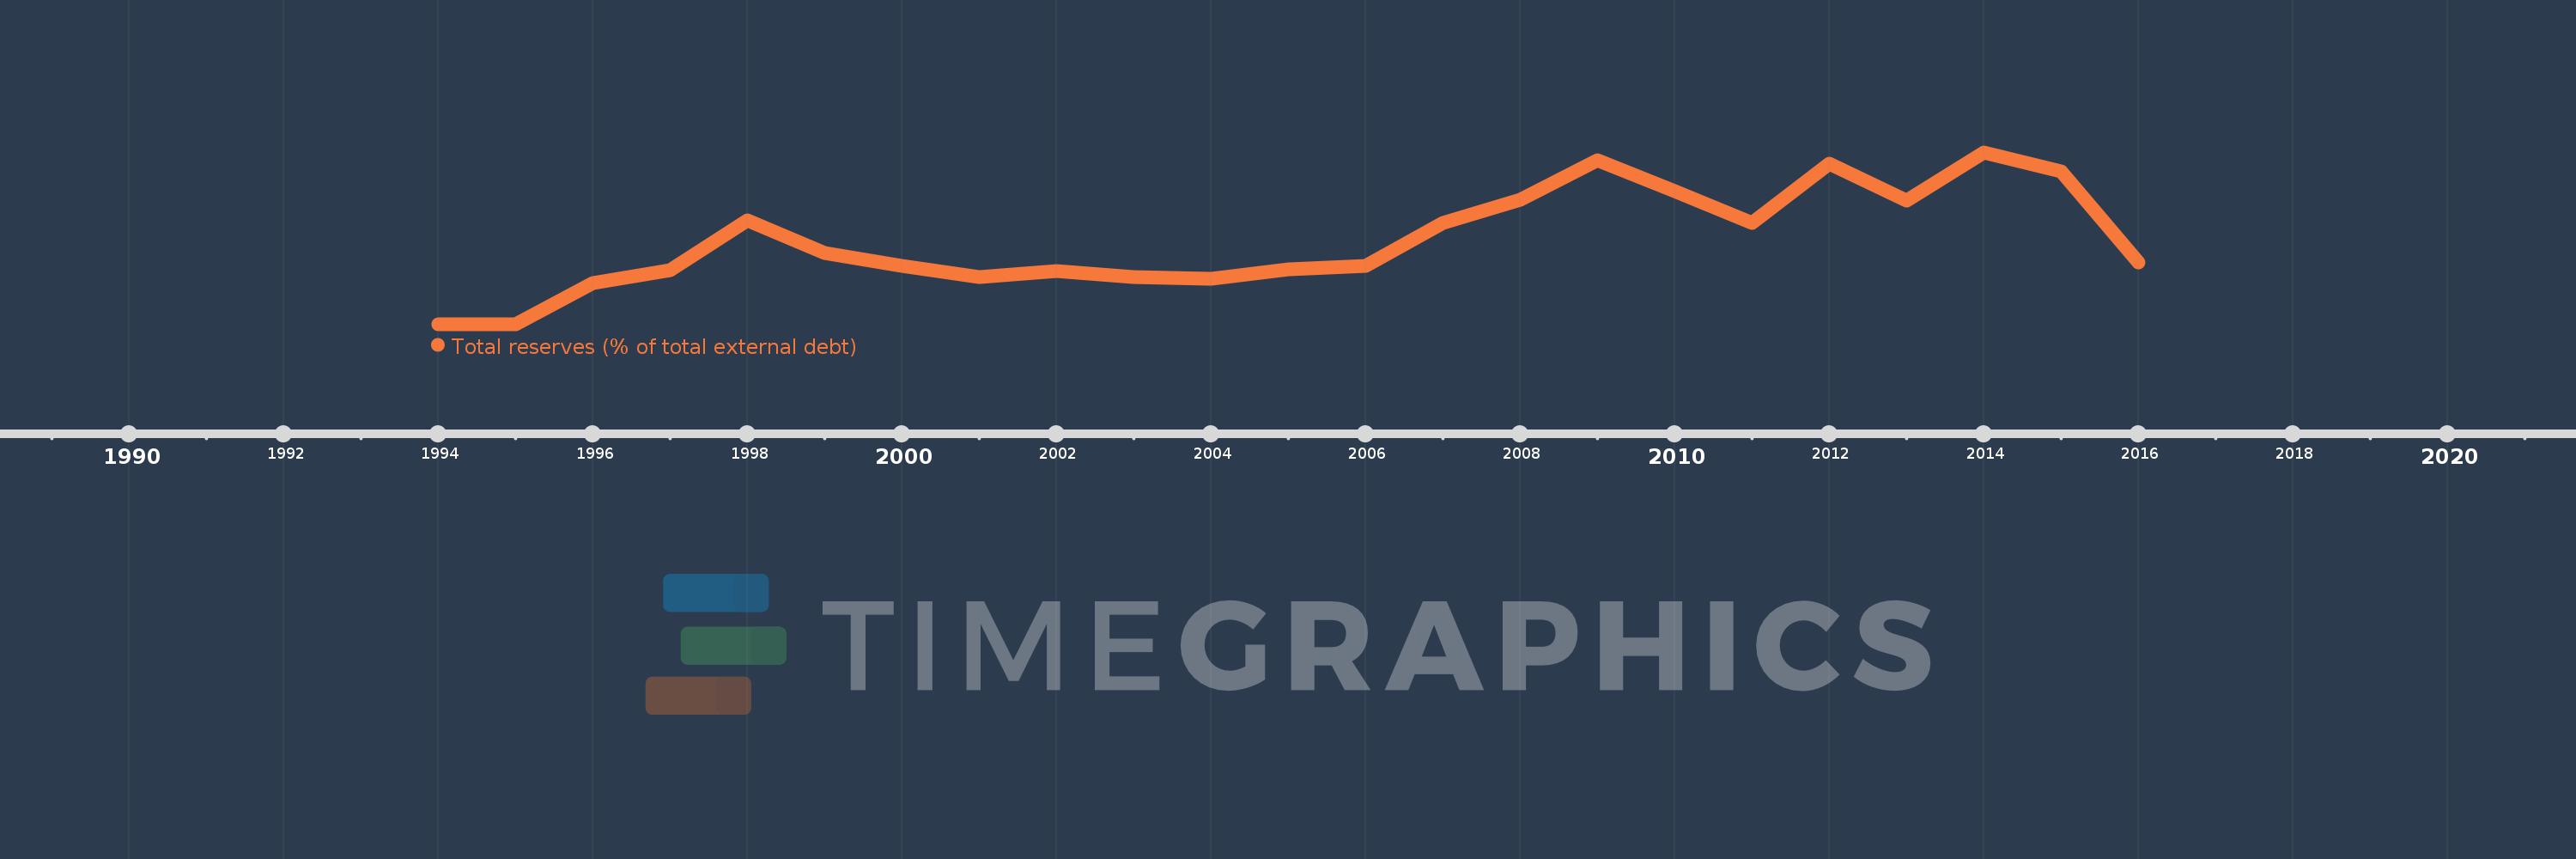
Cette échelle de temps montre un graphique de 1994 année à 2016 année Azerbaijan. Les données jusqu'à 1993 année ne sont pas présentés. Quantité d'observations actuelles selon dates: 23.

Source (désignation):

Les indicateurs du développement mondiale

Source (organisation):

World Bank, International Debt Statistics.

Catégories:

Financial Sector, External Debt

Dernière mise à jour

23 avr. 2017

Les indicateurs de changement de valeurs selon les années

En moyenne:
74.527
Minimum:
1.66
1 janv. 1994
Maximum:
150.775
1 janv. 2014
Pour la date d''observation
Valeur
Changement absolu
Le changement par rapport à la valeur précédente
1 janv. 1994
1.66
+1.66
0.0%
1 janv. 1995
1.803
+0.143
8.6%
1 janv. 1996
37.66
+35.857
1.99 milles%
1 janv. 1997
48.747
+11.086
29.44%
1 janv. 1998
91.981
+43.234
88.69%
1 janv. 1999
63.478
-28.503
-30.99%
1 janv. 2000
52.177
-11.302
-17.8%
1 janv. 2001
42.872
-9.305
-17.83%
1 janv. 2002
47.842
+4.97
11.59%
1 janv. 2003
42.59
-5.252
-10.98%
1 janv. 2004
41.36
-1.23
-2.89%
1 janv. 2005
49.561
+8.201
19.83%
1 janv. 2006
52.414
+2.853
5.76%
1 janv. 2007
89.358
+36.945
70.49%
1 janv. 2008
109.431
+20.072
22.46%
1 janv. 2009
143.813
+34.383
31.42%
1 janv. 2010
117.396
-26.417
-18.37%
1 janv. 2011
89.518
-27.878
-23.75%
1 janv. 2012
140.955
+51.437
57.46%
1 janv. 2013
109.165
-31.79
-22.55%
1 janv. 2014
150.775
+41.61
38.12%
1 janv. 2015
134.177
-16.599
-11.01%
1 janv. 2016
55.386
-78.791
-58.72%

Classement des pays selon les statistiques actuelles par années