33
/fr/
AIzaSyAYiBZKx7MnpbEhh9jyipgxe19OcubqV5w
August 1, 2025
68493
Angola
AGO
true
2
1
Total reserves (% of total external debt)
2016,2015,2014,2013,2012,2011,2010,2009,2008,2007,2006,2005,2004,2003,2002,2001,2000,1999,1998,1997,1996
Download
Bibliothèque de statistiques globales →Angola →

Total reserves (% of total external debt)

Cette statistique dans les autres pays:

AfghanistanAlbaniaAlgeriaAngolaArab WorldArgentinaArmeniaAzerbaijanBangladeshBelarusBelizeBeninBhutanBoliviaBosnia and HerzegovinaBotswanaBrazilBulgariaBurkina FasoBurundiCabo VerdeCambodiaCameroonCaribbean small statesCentral African RepublicCentral Europe and the BalticsChadChinaColombiaComorosCongo, Dem. Rep.Congo, Rep.Costa RicaCote d'IvoireDjiboutiDominicaDominican RepublicEarly-demographic dividendEast Asia & PacificEast Asia & Pacific (excluding high income)East Asia & Pacific (IDA & IBRD countries)EcuadorEgypt, Arab Rep.El SalvadorEritreaEthiopiaEurope & Central AsiaEurope & Central Asia (excluding high income)Europe & Central Asia (IDA & IBRD countries)FijiFragile and conflict affected situationsGabonGambia, TheGeorgiaGhanaGrenadaGuatemalaGuineaGuinea-BissauGuyanaHaitiHeavily indebted poor countries (HIPC)HondurasIBRD onlyIDA & IBRD totalIDA blendIDA onlyIDA totalIndiaIndonesiaIran, Islamic Rep.JamaicaJordanKazakhstanKenyaKosovoKyrgyz RepublicLao PDRLate-demographic dividendLatin America & Caribbean Latin America & Caribbean (excluding high income)Latin America & the Caribbean (IDA & IBRD countries)Least developed countries: UN classificationLebanonLesothoLiberiaLow & middle incomeLow incomeLower middle incomeMacedonia, FYRMadagascarMalawiMalaysiaMaldivesMaliMauritaniaMauritiusMexicoMiddle East & North AfricaMiddle East & North Africa (excluding high income)Middle East & North Africa (IDA & IBRD countries)Middle incomeMoldovaMongoliaMontenegroMoroccoMozambiqueMyanmarNepalNicaraguaNigerNigeriaOther small statesPacific island small statesPakistanPanamaPapua New GuineaParaguayPeruPhilippinesPre-demographic dividendRomaniaRussian FederationRwandaSamoaSao Tome and PrincipeSenegalSerbiaSierra LeoneSmall statesSolomon IslandsSouth AfricaSouth AsiaSouth Asia (IDA & IBRD)Sri LankaSt. LuciaSt. Vincent and the GrenadinesSub-Saharan Africa Sub-Saharan Africa (excluding high income)Sub-Saharan Africa (IDA & IBRD countries)SudanSwazilandSyrian Arab RepublicTajikistanTanzaniaThailandTogoTongaTunisiaTurkeyUgandaUkraineUpper middle incomeVanuatuVenezuela, RBVietnamYemen, Rep.ZambiaZimbabwe

La ligne de temps

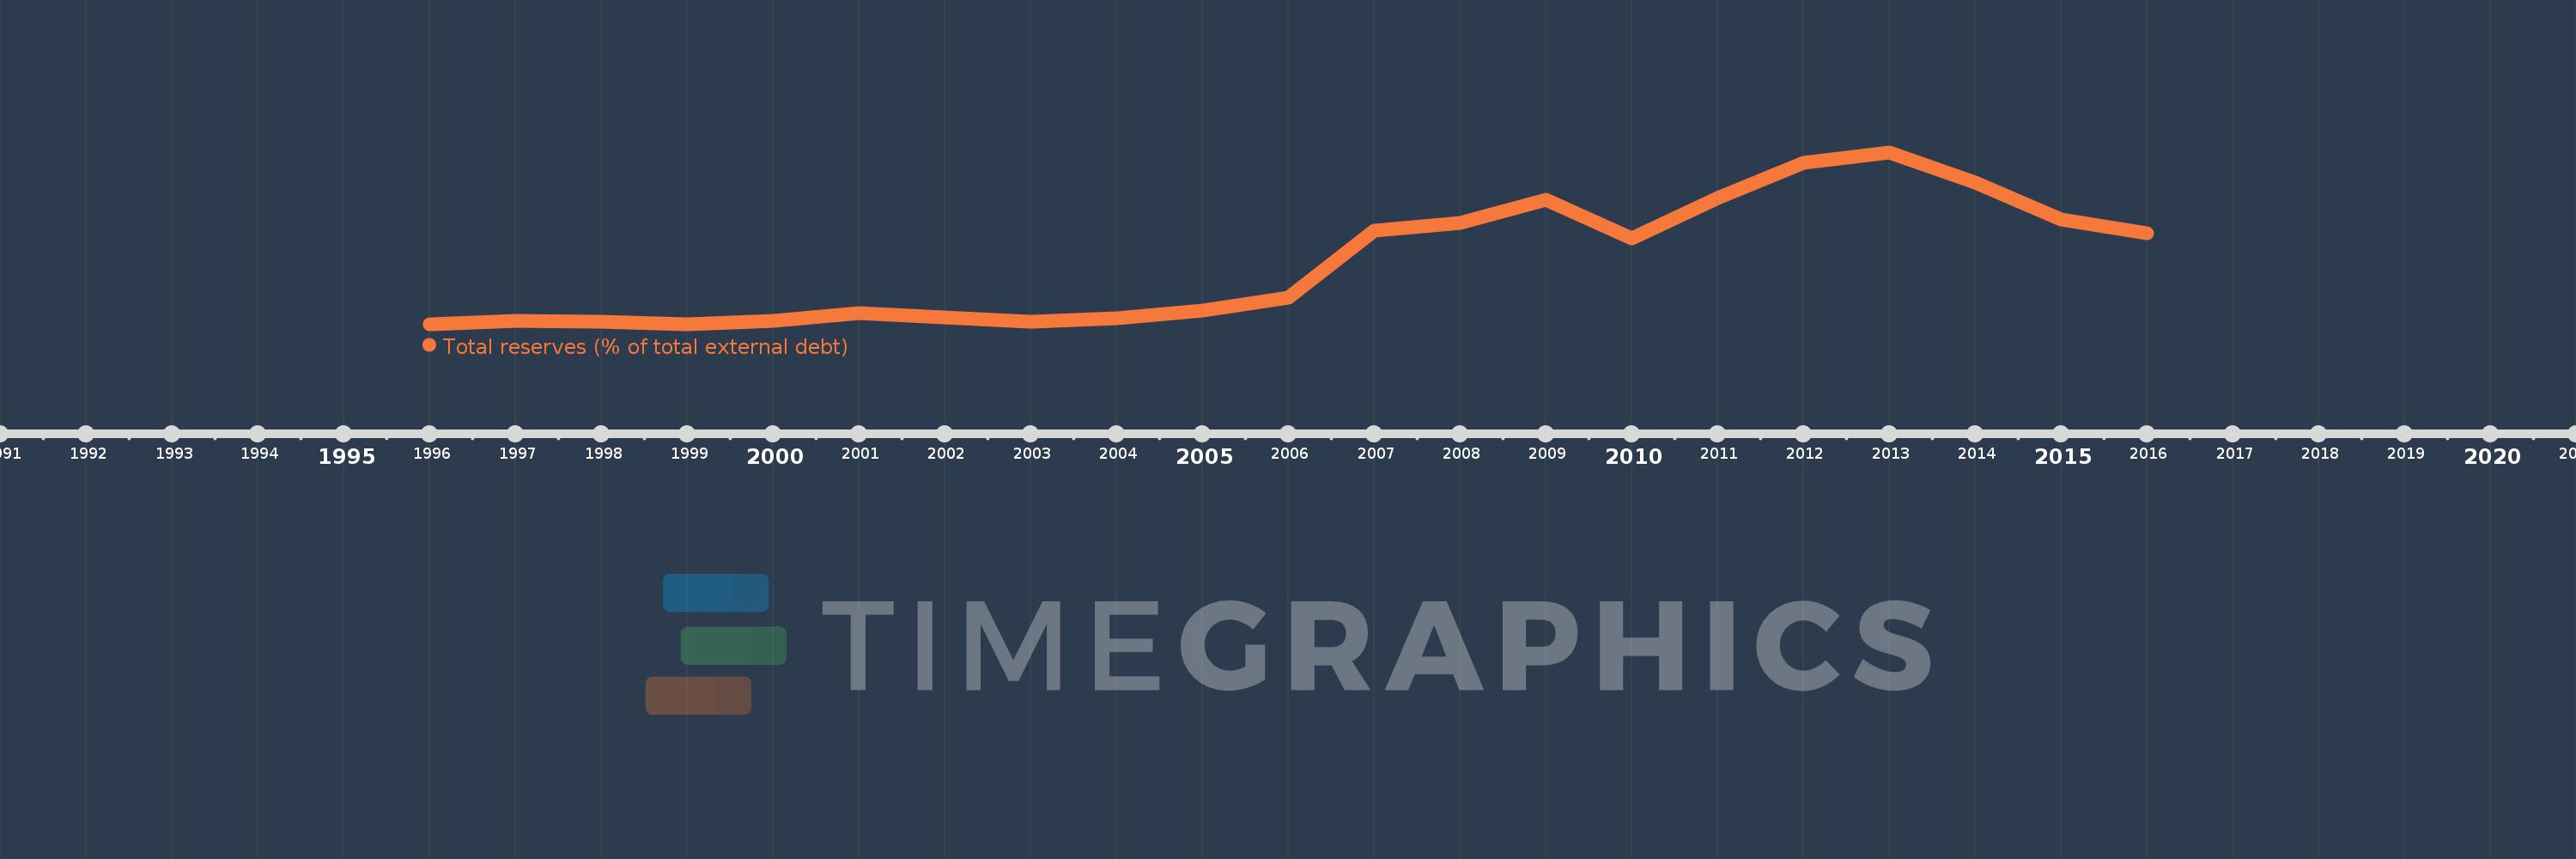
Cette échelle de temps montre un graphique de 1996 année à 2016 année Angola. Les données jusqu'à 1995 année ne sont pas présentés. Quantité d'observations actuelles selon dates: 21.

Source (désignation):

Les indicateurs du développement mondiale

Source (organisation):

World Bank, International Debt Statistics.

Catégories:

Financial Sector, External Debt

Dernière mise à jour

23 avr. 2017

Les indicateurs de changement de valeurs selon les années

En moyenne:
57.299
Minimum:
1.85
1 janv. 1996
Maximum:
158.315
1 janv. 2013
Pour la date d''observation
Valeur
Changement absolu
Le changement par rapport à la valeur précédente
1 janv. 1996
1.85
+1.85
0.0%
1 janv. 1997
5.231
+3.38
182.68%
1 janv. 1998
3.985
-1.246
-23.82%
1 janv. 1999
1.887
-2.098
-52.66%
1 janv. 2000
4.648
+2.761
146.37%
1 janv. 2001
12.272
+7.624
164.03%
1 janv. 2002
8.339
-3.934
-32.05%
1 janv. 2003
4.123
-4.216
-50.56%
1 janv. 2004
6.969
+2.847
69.05%
1 janv. 2005
14.041
+7.072
101.47%
1 janv. 2006
26.152
+12.111
86.26%
1 janv. 2007
86.938
+60.786
232.43%
1 janv. 2008
93.841
+6.903
7.94%
1 janv. 2009
115.275
+21.434
22.84%
1 janv. 2010
80.31
-34.965
-30.33%
1 janv. 2011
116.522
+36.213
45.09%
1 janv. 2012
149.165
+32.643
28.01%
1 janv. 2013
158.315
+9.15
6.13%
1 janv. 2014
131.101
-27.214
-17.19%
1 janv. 2015
97.327
-33.774
-25.76%
1 janv. 2016
84.993
-12.334
-12.67%

Classement des pays selon les statistiques actuelles par années