33
/fr/
AIzaSyAYiBZKx7MnpbEhh9jyipgxe19OcubqV5w
August 1, 2025
90260
Botswana
BWA
true
2
1
Persistence to grade 5, male (% of cohort)
2013,2009,2006,2005,2004,2003,2002,2001,2000,1999,1997,1995,1994,1993,1992,1991,1990,1989,1988,1987,1986,1985,1983,1982
Download
Bibliothèque de statistiques globales →Botswana →

Persistence to grade 5, male (% of cohort)

Cette statistique dans les autres pays:

AfghanistanAlbaniaAlgeriaAndorraAngolaAntigua and BarbudaArab WorldArgentinaArubaBahamas, TheBahrainBangladeshBarbadosBelgiumBelizeBeninBermudaBhutanBoliviaBosnia and HerzegovinaBotswanaBrunei DarussalamBurkina FasoBurundiCabo VerdeCambodiaCameroonCanadaCaribbean small statesCayman IslandsCentral African RepublicChadChileChinaColombiaComorosCongo, Dem. Rep.Congo, Rep.Costa RicaCote d'IvoireCubaCyprusCzech RepublicDenmarkDjiboutiDominicaDominican RepublicEarly-demographic dividendEast Asia & PacificEast Asia & Pacific (excluding high income)East Asia & Pacific (IDA & IBRD countries)EcuadorEgypt, Arab Rep.El SalvadorEquatorial GuineaEritreaEstoniaEthiopiaFijiFinlandFranceGabonGambia, TheGeorgiaGhanaGreeceGrenadaGuatemalaGuineaGuinea-BissauGuyanaHaitiHeavily indebted poor countries (HIPC)HondurasHong Kong SAR, ChinaHungaryIcelandIDA blendIDA onlyIDA totalIndiaIndonesiaIran, Islamic Rep.IraqIrelandIsraelItalyJamaicaJapanJordanKenyaKiribatiKorea, Rep.KuwaitLao PDRLate-demographic dividendLatviaLeast developed countries: UN classificationLebanonLesothoLiberiaLibyaLiechtensteinLow incomeLower middle incomeLuxembourgMacao SAR, ChinaMadagascarMalawiMalaysiaMaldivesMaliMaltaMarshall IslandsMauritaniaMauritiusMexicoMiddle East & North AfricaMiddle East & North Africa (excluding high income)Middle East & North Africa (IDA & IBRD countries)MontenegroMoroccoMozambiqueMyanmarNamibiaNepalNetherlandsNicaraguaNigerNigeriaNorwayOmanOther small statesPacific island small statesPakistanPanamaPapua New GuineaParaguayPeruPhilippinesPolandPortugalPre-demographic dividendQatarRwandaSamoaSan MarinoSao Tome and PrincipeSaudi ArabiaSenegalSeychellesSierra LeoneSingaporeSloveniaSolomon IslandsSouth AfricaSouth AsiaSouth Asia (IDA & IBRD)SpainSri LankaSt. Kitts and NevisSt. LuciaSt. Vincent and the GrenadinesSub-Saharan Africa Sub-Saharan Africa (excluding high income)Sub-Saharan Africa (IDA & IBRD countries)SudanSurinameSwazilandSwedenSwitzerlandSyrian Arab RepublicTanzaniaThailandTimor-LesteTogoTongaTrinidad and TobagoTunisiaTurkeyUgandaUnited Arab EmiratesUpper middle incomeUruguayVanuatuVenezuela, RBVietnamYemen, Rep.ZambiaZimbabwe

La ligne de temps

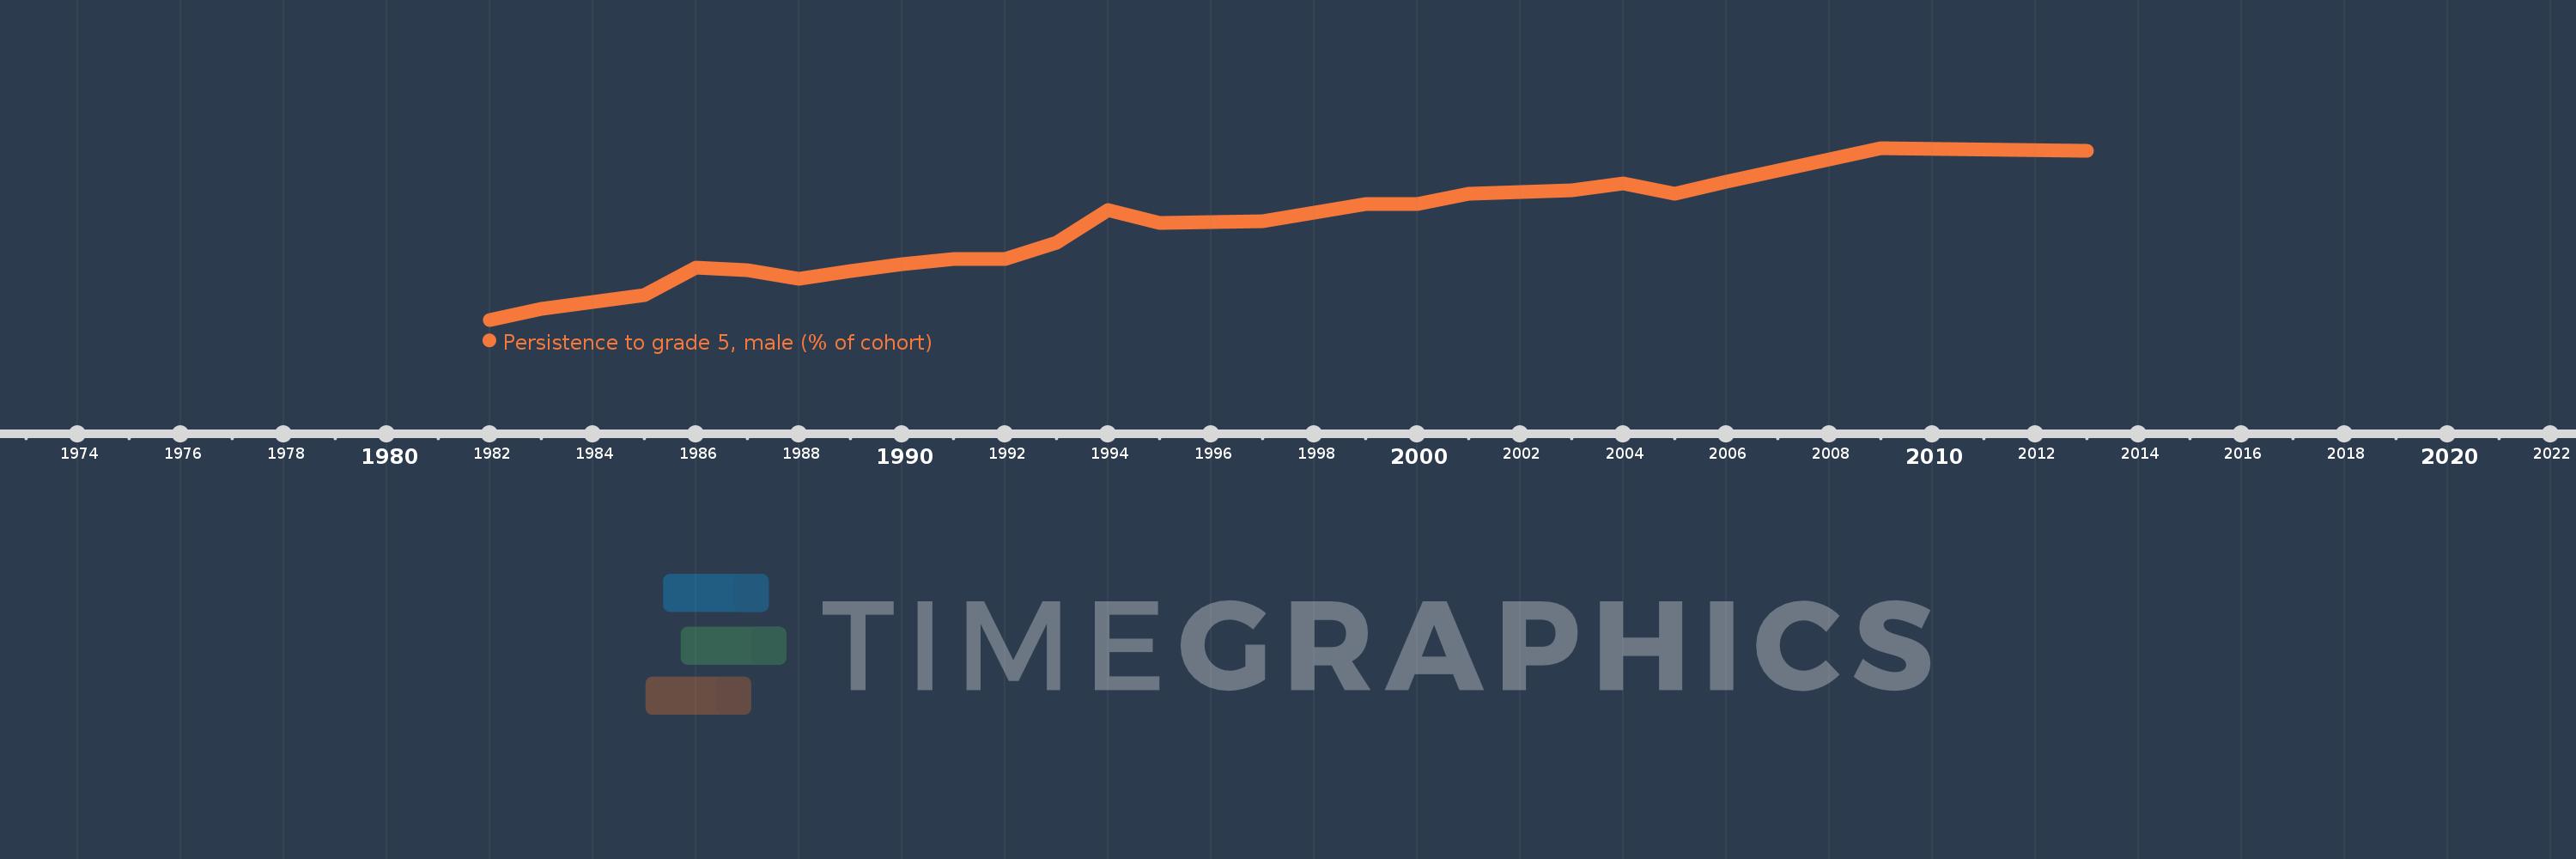
Cette échelle de temps montre un graphique de 1982 année à 2013 année Botswana. Les données jusqu'à 1981 année ne sont pas présentés. Quantité d'observations actuelles selon dates: 24.

Source (désignation):

Les indicateurs du développement mondiale

Source (organisation):

United Nations Educational, Scientific, and Cultural Organization (UNESCO) Institute for Statistics.

Catégories:

Education, Gender

Dernière mise à jour

23 avr. 2017

Les indicateurs de changement de valeurs selon les années

En moyenne:
78.8
Minimum:
60.507
1 janv. 1982
Maximum:
95.729
1 janv. 2009
Pour la date d''observation
Valeur
Changement absolu
Le changement par rapport à la valeur précédente
1 janv. 1982
60.507
+60.507
0.0%
1 janv. 1983
62.826
+2.319
3.83%
1 janv. 1985
65.561
+2.735
4.35%
1 janv. 1986
71.182
+5.621
8.57%
1 janv. 1987
70.706
-0.476
-0.67%
1 janv. 1988
68.821
-1.884
-2.67%
1 janv. 1989
70.507
+1.685
2.45%
1 janv. 1990
71.856
+1.349
1.91%
1 janv. 1991
72.976
+1.12
1.56%
1 janv. 1992
72.949
-0.027
-0.04%
1 janv. 1993
76.343
+3.394
4.65%
1 janv. 1994
82.958
+6.615
8.66%
1 janv. 1995
80.371
-2.587
-3.12%
1 janv. 1997
80.721
+0.35
0.44%
1 janv. 1999
84.202
+3.481
4.31%
1 janv. 2000
84.311
+0.109
0.13%
1 janv. 2001
86.325
+2.013
2.39%
1 janv. 2002
86.63
+0.305
0.35%
1 janv. 2003
86.988
+0.358
0.41%
1 janv. 2004
88.385
+1.397
1.61%
1 janv. 2005
86.381
-2.004
-2.27%
1 janv. 2006
88.824
+2.443
2.83%
1 janv. 2009
95.729
+6.905
7.77%
1 janv. 2013
95.151
-0.579
-0.6%

Classement des pays selon les statistiques actuelles par années