33
/fr/
AIzaSyAYiBZKx7MnpbEhh9jyipgxe19OcubqV5w
August 1, 2025
203387
Mozambique
MOZ
true
2
1
Persistence to grade 5, male (% of cohort)
2014,2013,2012,2011,2010,2009,2008,2007,2006,2005,2002,2001,2000,1999,1996,1995,1994,1993,1992,1991,1990,1989,1988,1974
Download
Bibliothèque de statistiques globales →Mozambique →

Persistence to grade 5, male (% of cohort)

Cette statistique dans les autres pays:

AfghanistanAlbaniaAlgeriaAndorraAngolaAntigua and BarbudaArab WorldArgentinaArubaBahamas, TheBahrainBangladeshBarbadosBelgiumBelizeBeninBermudaBhutanBoliviaBosnia and HerzegovinaBotswanaBrunei DarussalamBurkina FasoBurundiCabo VerdeCambodiaCameroonCanadaCaribbean small statesCayman IslandsCentral African RepublicChadChileChinaColombiaComorosCongo, Dem. Rep.Congo, Rep.Costa RicaCote d'IvoireCubaCyprusCzech RepublicDenmarkDjiboutiDominicaDominican RepublicEarly-demographic dividendEast Asia & PacificEast Asia & Pacific (excluding high income)East Asia & Pacific (IDA & IBRD countries)EcuadorEgypt, Arab Rep.El SalvadorEquatorial GuineaEritreaEstoniaEthiopiaFijiFinlandFranceGabonGambia, TheGeorgiaGhanaGreeceGrenadaGuatemalaGuineaGuinea-BissauGuyanaHaitiHeavily indebted poor countries (HIPC)HondurasHong Kong SAR, ChinaHungaryIcelandIDA blendIDA onlyIDA totalIndiaIndonesiaIran, Islamic Rep.IraqIrelandIsraelItalyJamaicaJapanJordanKenyaKiribatiKorea, Rep.KuwaitLao PDRLate-demographic dividendLatviaLeast developed countries: UN classificationLebanonLesothoLiberiaLibyaLiechtensteinLow incomeLower middle incomeLuxembourgMacao SAR, ChinaMadagascarMalawiMalaysiaMaldivesMaliMaltaMarshall IslandsMauritaniaMauritiusMexicoMiddle East & North AfricaMiddle East & North Africa (excluding high income)Middle East & North Africa (IDA & IBRD countries)MontenegroMoroccoMozambiqueMyanmarNamibiaNepalNetherlandsNicaraguaNigerNigeriaNorwayOmanOther small statesPacific island small statesPakistanPanamaPapua New GuineaParaguayPeruPhilippinesPolandPortugalPre-demographic dividendQatarRwandaSamoaSan MarinoSao Tome and PrincipeSaudi ArabiaSenegalSeychellesSierra LeoneSingaporeSloveniaSolomon IslandsSouth AfricaSouth AsiaSouth Asia (IDA & IBRD)SpainSri LankaSt. Kitts and NevisSt. LuciaSt. Vincent and the GrenadinesSub-Saharan Africa Sub-Saharan Africa (excluding high income)Sub-Saharan Africa (IDA & IBRD countries)SudanSurinameSwazilandSwedenSwitzerlandSyrian Arab RepublicTanzaniaThailandTimor-LesteTogoTongaTrinidad and TobagoTunisiaTurkeyUgandaUnited Arab EmiratesUpper middle incomeUruguayVanuatuVenezuela, RBVietnamYemen, Rep.ZambiaZimbabwe

La ligne de temps

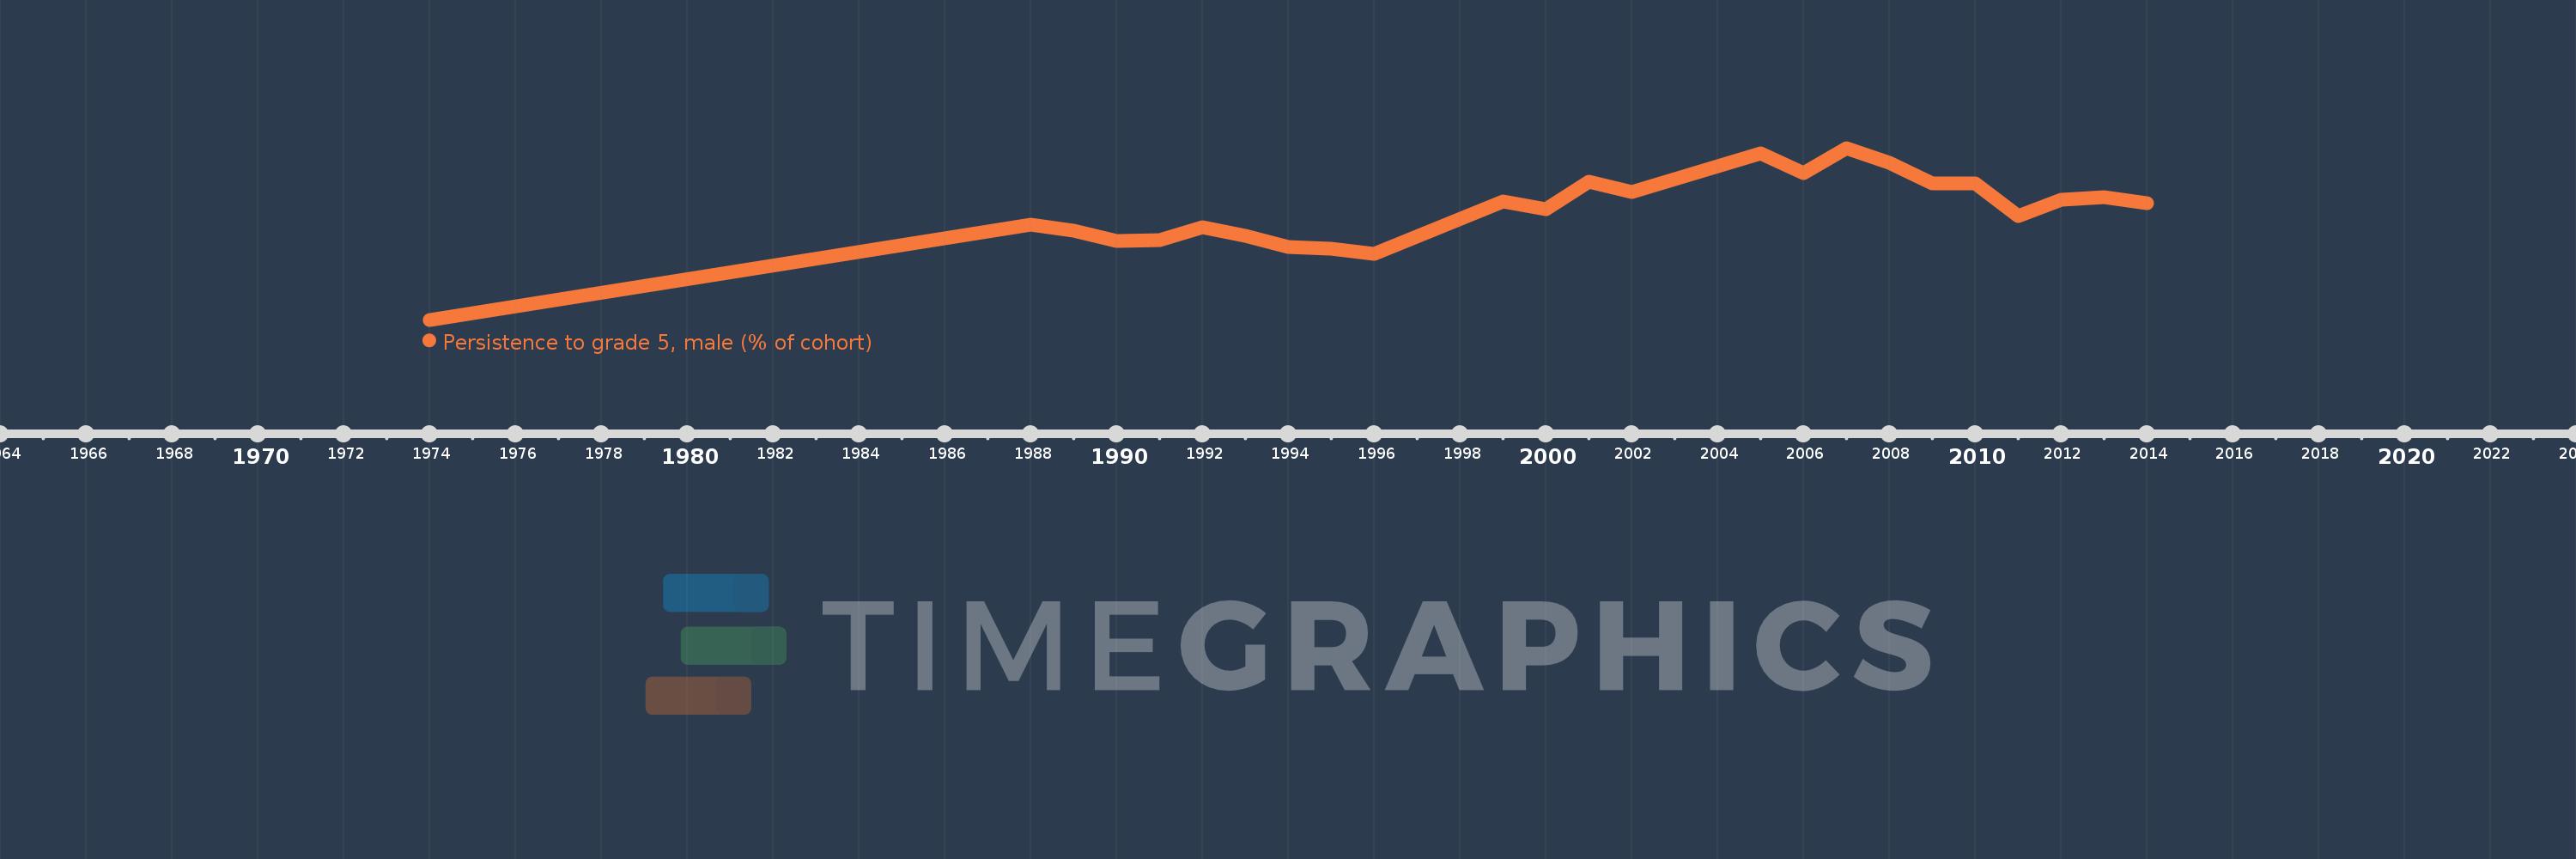
Cette échelle de temps montre un graphique de 1974 année à 2014 année Mozambique. Les données jusqu'à 1973 année ne sont pas présentés. Quantité d'observations actuelles selon dates: 24.

Source (désignation):

Les indicateurs du développement mondiale

Source (organisation):

United Nations Educational, Scientific, and Cultural Organization (UNESCO) Institute for Statistics.

Catégories:

Education, Gender

Dernière mise à jour

23 avr. 2017

Les indicateurs de changement de valeurs selon les années

En moyenne:
46.689
Minimum:
10.682
1 janv. 1974
Maximum:
67.768
1 janv. 2007
Pour la date d''observation
Valeur
Changement absolu
Le changement par rapport à la valeur précédente
1 janv. 1974
10.682
+10.682
0.0%
1 janv. 1988
42.291
+31.609
295.91%
1 janv. 1989
40.236
-2.056
-4.86%
1 janv. 1990
36.72
-3.516
-8.74%
1 janv. 1991
37.173
+0.454
1.24%
1 janv. 1992
41.539
+4.366
11.74%
1 janv. 1993
38.6
-2.939
-7.08%
1 janv. 1994
34.87
-3.73
-9.66%
1 janv. 1995
34.223
-0.647
-1.86%
1 janv. 1996
32.664
-1.56
-4.56%
1 janv. 1999
49.875
+17.211
52.69%
1 janv. 2000
47.375
-2.499
-5.01%
1 janv. 2001
56.557
+9.182
19.38%
1 janv. 2002
53.122
-3.435
-6.07%
1 janv. 2005
66.02
+12.898
24.28%
1 janv. 2006
59.433
-6.587
-9.98%
1 janv. 2007
67.768
+8.335
14.02%
1 janv. 2008
62.701
-5.067
-7.48%
1 janv. 2009
56.111
-6.589
-10.51%
1 janv. 2010
56.086
-0.025
-0.04%
1 janv. 2011
45.071
-11.016
-19.64%
1 janv. 2012
50.588
+5.517
12.24%
1 janv. 2013
51.446
+0.858
1.7%
1 janv. 2014
49.382
-2.063
-4.01%

Classement des pays selon les statistiques actuelles par années