33
/fr/
AIzaSyAYiBZKx7MnpbEhh9jyipgxe19OcubqV5w
August 1, 2025
129760
Estonia
EST
true
2
1
Persistence to grade 5, male (% of cohort)
2013,2012,2011,2010,2009,2008,2007,2006,2005,2004,2003,2002,2001,2000,1999,1997,1996
Download
Bibliothèque de statistiques globales →Estonia →

Persistence to grade 5, male (% of cohort)

Cette statistique dans les autres pays:

AfghanistanAlbaniaAlgeriaAndorraAngolaAntigua and BarbudaArab WorldArgentinaArubaBahamas, TheBahrainBangladeshBarbadosBelgiumBelizeBeninBermudaBhutanBoliviaBosnia and HerzegovinaBotswanaBrunei DarussalamBurkina FasoBurundiCabo VerdeCambodiaCameroonCanadaCaribbean small statesCayman IslandsCentral African RepublicChadChileChinaColombiaComorosCongo, Dem. Rep.Congo, Rep.Costa RicaCote d'IvoireCubaCyprusCzech RepublicDenmarkDjiboutiDominicaDominican RepublicEarly-demographic dividendEast Asia & PacificEast Asia & Pacific (excluding high income)East Asia & Pacific (IDA & IBRD countries)EcuadorEgypt, Arab Rep.El SalvadorEquatorial GuineaEritreaEstoniaEthiopiaFijiFinlandFranceGabonGambia, TheGeorgiaGhanaGreeceGrenadaGuatemalaGuineaGuinea-BissauGuyanaHaitiHeavily indebted poor countries (HIPC)HondurasHong Kong SAR, ChinaHungaryIcelandIDA blendIDA onlyIDA totalIndiaIndonesiaIran, Islamic Rep.IraqIrelandIsraelItalyJamaicaJapanJordanKenyaKiribatiKorea, Rep.KuwaitLao PDRLate-demographic dividendLatviaLeast developed countries: UN classificationLebanonLesothoLiberiaLibyaLiechtensteinLow incomeLower middle incomeLuxembourgMacao SAR, ChinaMadagascarMalawiMalaysiaMaldivesMaliMaltaMarshall IslandsMauritaniaMauritiusMexicoMiddle East & North AfricaMiddle East & North Africa (excluding high income)Middle East & North Africa (IDA & IBRD countries)MontenegroMoroccoMozambiqueMyanmarNamibiaNepalNetherlandsNicaraguaNigerNigeriaNorwayOmanOther small statesPacific island small statesPakistanPanamaPapua New GuineaParaguayPeruPhilippinesPolandPortugalPre-demographic dividendQatarRwandaSamoaSan MarinoSao Tome and PrincipeSaudi ArabiaSenegalSeychellesSierra LeoneSingaporeSloveniaSolomon IslandsSouth AfricaSouth AsiaSouth Asia (IDA & IBRD)SpainSri LankaSt. Kitts and NevisSt. LuciaSt. Vincent and the GrenadinesSub-Saharan Africa Sub-Saharan Africa (excluding high income)Sub-Saharan Africa (IDA & IBRD countries)SudanSurinameSwazilandSwedenSwitzerlandSyrian Arab RepublicTanzaniaThailandTimor-LesteTogoTongaTrinidad and TobagoTunisiaTurkeyUgandaUnited Arab EmiratesUpper middle incomeUruguayVanuatuVenezuela, RBVietnamYemen, Rep.ZambiaZimbabwe

La ligne de temps

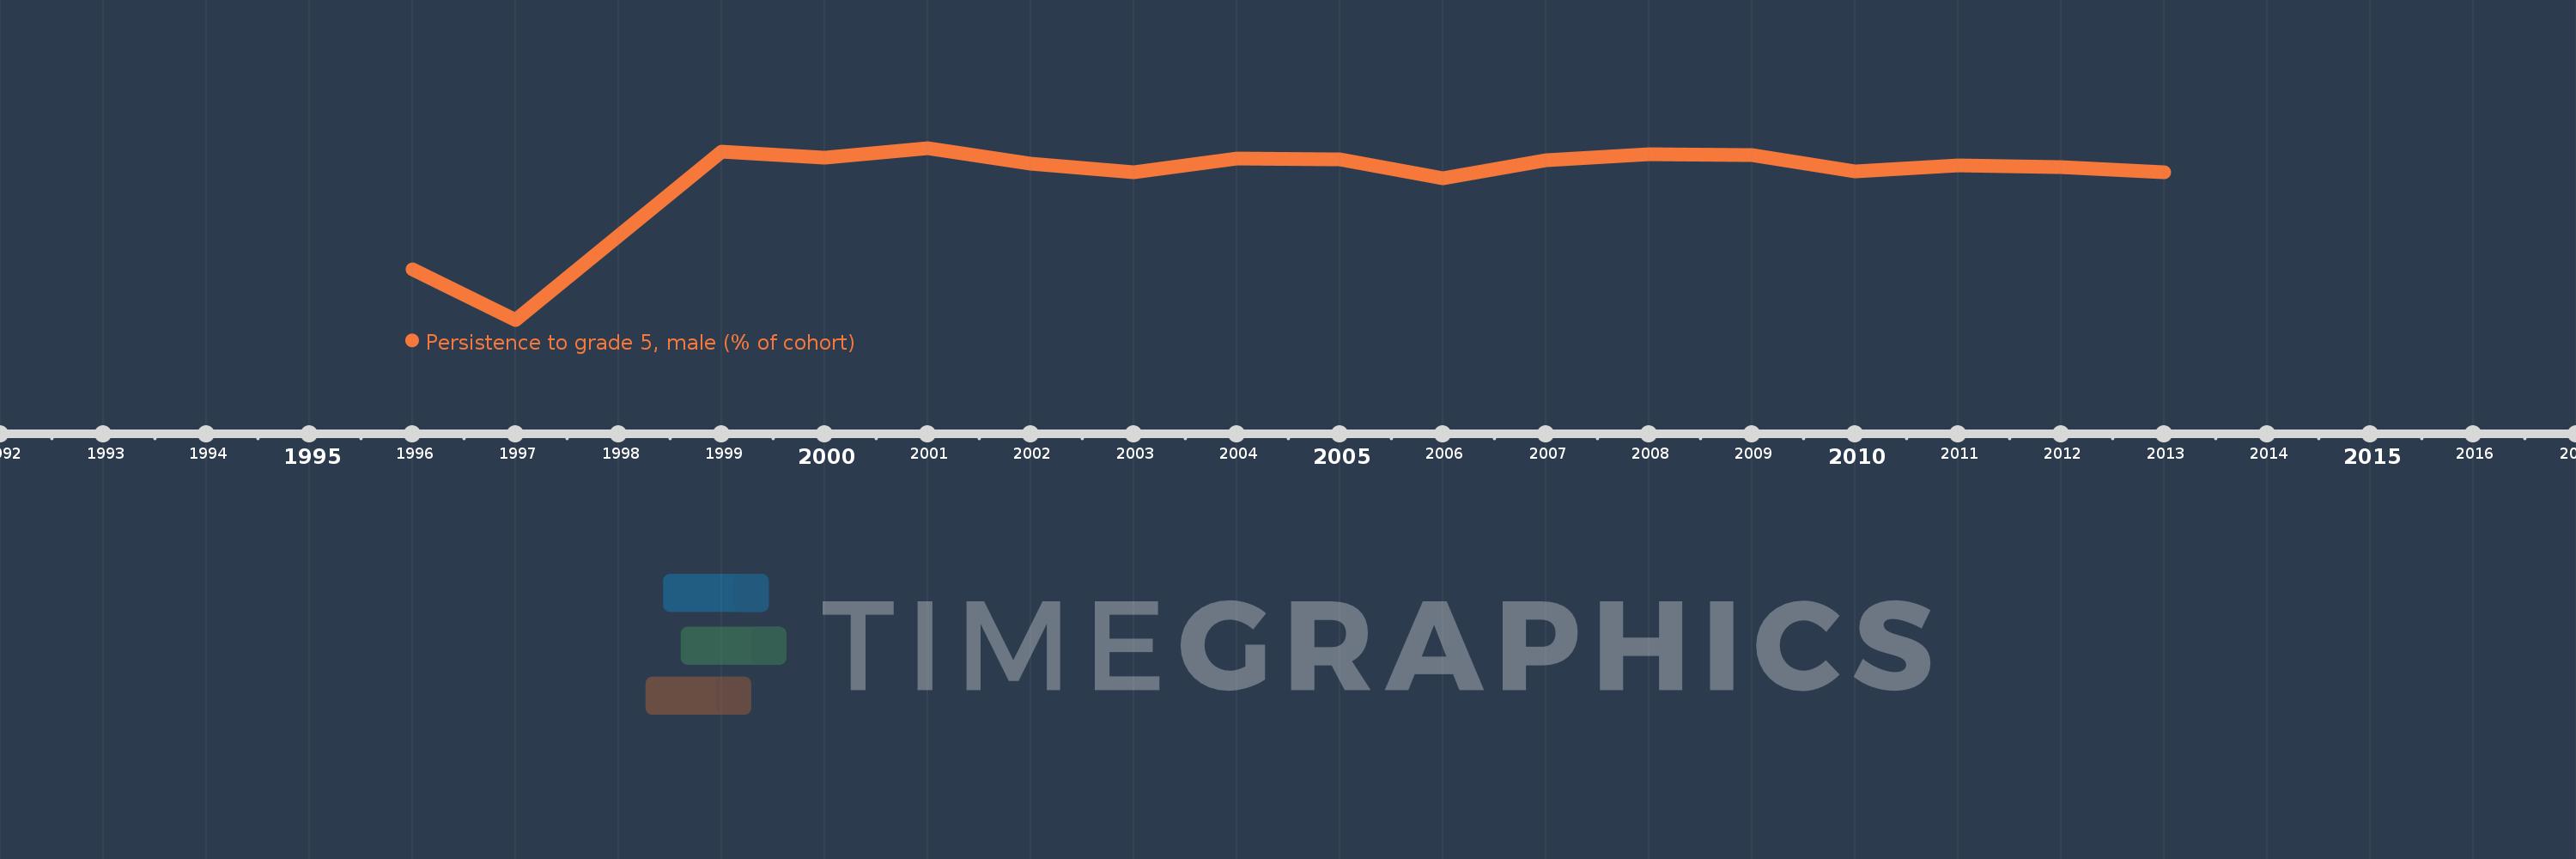
Cette échelle de temps montre un graphique de 1996 année à 2013 année Estonia. Les données jusqu'à 1995 année ne sont pas présentés. Quantité d'observations actuelles selon dates: 17.

Source (désignation):

Les indicateurs du développement mondiale

Source (organisation):

United Nations Educational, Scientific, and Cultural Organization (UNESCO) Institute for Statistics.

Catégories:

Education, Gender

Dernière mise à jour

23 avr. 2017

Les indicateurs de changement de valeurs selon les années

En moyenne:
96.779
Minimum:
83.884
1 janv. 1997
Maximum:
99.506
1 janv. 2001
Pour la date d''observation
Valeur
Changement absolu
Le changement par rapport à la valeur précédente
1 janv. 1996
88.465
+88.465
0.0%
1 janv. 1997
83.884
-4.581
-5.18%
1 janv. 1999
99.163
+15.279
18.21%
1 janv. 2000
98.59
-0.573
-0.58%
1 janv. 2001
99.506
+0.916
0.93%
1 janv. 2002
98.065
-1.441
-1.45%
1 janv. 2003
97.257
-0.809
-0.82%
1 janv. 2004
98.524
+1.267
1.3%
1 janv. 2005
98.444
-0.08
-0.08%
1 janv. 2006
96.739
-1.705
-1.73%
1 janv. 2007
98.36
+1.622
1.68%
1 janv. 2008
98.971
+0.611
0.62%
1 janv. 2009
98.831
-0.14
-0.14%
1 janv. 2010
97.392
-1.44
-1.46%
1 janv. 2011
97.957
+0.565
0.58%
1 janv. 2012
97.778
-0.179
-0.18%
1 janv. 2013
97.322
-0.455
-0.47%

Classement des pays selon les statistiques actuelles par années