29
/fr/
fr
AIzaSyAYiBZKx7MnpbEhh9jyipgxe19OcubqV5w
April 1, 2024
87039
Bolivia
BOL
true
2
1
Customs and other import duties (current LCU)
2008,2007,2006,2005,2004,2003,2002,2001,2000,1999,1998,1997,1996,1995,1994,1993,1992,1991,1990,1989,1988,1987,1986
Cette statistique dans les autres pays:
AfghanistanAlbaniaAlgeriaAngolaAntigua and BarbudaArgentinaArmeniaAustraliaAustriaAzerbaijanBahamas, TheBahrainBangladeshBarbadosBelarusBelizeBeninBhutanBoliviaBosnia and HerzegovinaBotswanaBrazilBulgariaBurkina FasoBurundiCabo VerdeCambodiaCentral African RepublicChileChinaColombiaCongo, Dem. Rep.Congo, Rep.Costa RicaCote d'IvoireCroatiaCyprusCzech RepublicDenmarkDominicaDominican RepublicEgypt, Arab Rep.El SalvadorEquatorial GuineaEstoniaEthiopiaFijiFinlandFranceGambia, TheGeorgiaGermanyGhanaGreeceGrenadaGuatemalaHondurasHong Kong SAR, ChinaHungaryIcelandIndiaIndonesiaIran, Islamic Rep.IraqIrelandIsraelItalyJamaicaJapanJordanKazakhstanKenyaKiribatiKorea, Rep.KuwaitKyrgyz RepublicLao PDRLatviaLebanonLiberiaLithuaniaLuxembourgMacedonia, FYRMadagascarMalawiMalaysiaMaldivesMaliMaltaMauritiusMexicoMicronesia, Fed. Sts.MoldovaMongoliaMoroccoMozambiqueMyanmarNamibiaNepalNetherlandsNew ZealandNicaraguaNorwayOmanPakistanPanamaPapua New GuineaParaguayPeruPhilippinesPolandPortugalQatarRomaniaRussian FederationRwandaSamoaSan MarinoSao Tome and PrincipeSenegalSerbiaSeychellesSierra LeoneSingaporeSlovak RepublicSloveniaSolomon IslandsSouth AfricaSpainSri LankaSt. Kitts and NevisSt. LuciaSurinameSwazilandSwedenSwitzerlandSyrian Arab RepublicTajikistanTanzaniaThailandTogoTrinidad and TobagoTunisiaTurkeyUgandaUkraineUnited Arab EmiratesUnited KingdomUnited StatesUruguayVanuatuVenezuela, RBVietnamWest Bank and GazaYemen, Rep.ZambiaZimbabwe La ligne de temps
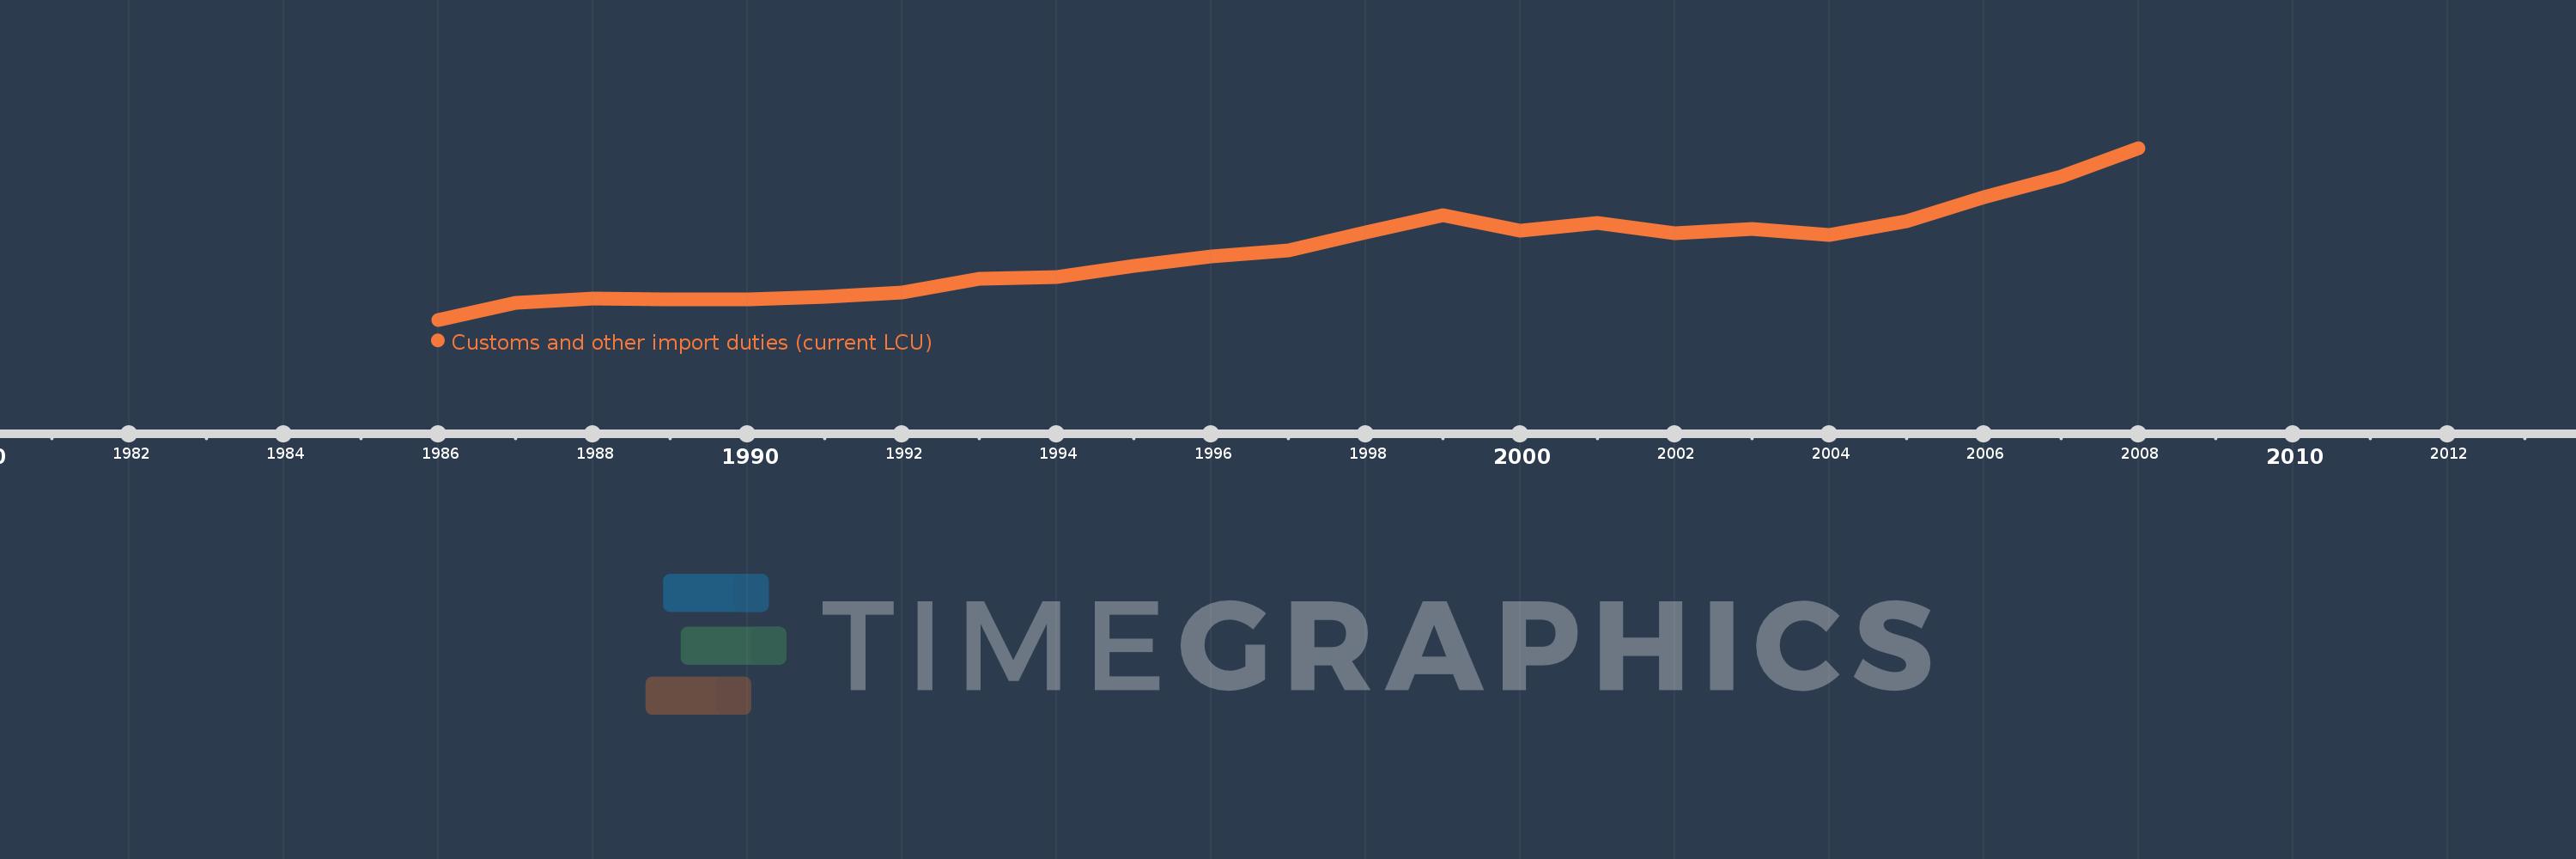
Cette échelle de temps montre un graphique de 1986 année à 2008 année Bolivia. Les données jusqu'à 1985 année ne sont pas présentés. Quantité d'observations actuelles selon dates: 23.
Source (désignation):
Les indicateurs du développement mondiale
Source (organisation):
International Monetary Fund, Government Finance Statistics Yearbook and data files.
Catégories:
Public Sector
Dernière mise à jour
23 avr. 2017
Les indicateurs de changement de valeurs selon les années
Minimum:
30.2 mln.
1 janv. 1986
Maximum:
895.628 mln.
1 janv. 2008
Pour la date d''observation
Valeur
Changement absolu
Le changement par rapport à la valeur précédente
1 janv. 1986
30.2 mln.
+30.2 mln.
0.0%
1 janv. 1987
114.2 mln.
+84.0 mln.
278.15%
1 janv. 1988
135.6 mln.
+21.4 mln.
18.74%
1 janv. 1989
133.8 mln.
-1.8 mln.
-1.33%
1 janv. 1990
131.3 mln.
-2.5 mln.
-1.87%
1 janv. 1991
145.3 mln.
+14.0 mln.
10.66%
1 janv. 1992
169.1 mln.
+23.8 mln.
16.38%
1 janv. 1993
234.6 mln.
+65.5 mln.
38.73%
1 janv. 1994
244.5 mln.
+9.9 mln.
4.22%
1 janv. 1995
301.5 mln.
+57.0 mln.
23.31%
1 janv. 1996
349.8 mln.
+48.3 mln.
16.02%
1 janv. 1997
377.9 mln.
+28.1 mln.
8.03%
1 janv. 1998
472.0 mln.
+94.1 mln.
24.9%
1 janv. 1999
556.7 mln.
+84.7 mln.
17.94%
1 janv. 2000
480.7 mln.
-76.0 mln.
-13.65%
1 janv. 2001
519.7 mln.
+39.0 mln.
8.11%
1 janv. 2002
465.08 mln.
-54.62 mln.
-10.51%
1 janv. 2003
488.221 mln.
+23.141 mln.
4.98%
1 janv. 2004
455.179 mln.
-33.042 mln.
-6.77%
1 janv. 2005
528.3 mln.
+73.121 mln.
16.06%
1 janv. 2006
648.448 mln.
+120.148 mln.
22.74%
1 janv. 2007
750.304 mln.
+101.856 mln.
15.71%
1 janv. 2008
895.628 mln.
+145.323 mln.
19.37%
Classement des pays selon les statistiques actuelles par années
Commentaires: