29
/fr/
fr
AIzaSyAYiBZKx7MnpbEhh9jyipgxe19OcubqV5w
April 1, 2024
150188
Honduras
HND
true
2
1
Customs and other import duties (current LCU)
2016,2015,2014,2013,2012,2011,2010,2009,2008,2007,2006,2005,2004,1982,1981,1980,1979,1978,1977,1976,1975,1974,1973
Cette statistique dans les autres pays:
AfghanistanAlbaniaAlgeriaAngolaAntigua and BarbudaArgentinaArmeniaAustraliaAustriaAzerbaijanBahamas, TheBahrainBangladeshBarbadosBelarusBelizeBeninBhutanBoliviaBosnia and HerzegovinaBotswanaBrazilBulgariaBurkina FasoBurundiCabo VerdeCambodiaCentral African RepublicChileChinaColombiaCongo, Dem. Rep.Congo, Rep.Costa RicaCote d'IvoireCroatiaCyprusCzech RepublicDenmarkDominicaDominican RepublicEgypt, Arab Rep.El SalvadorEquatorial GuineaEstoniaEthiopiaFijiFinlandFranceGambia, TheGeorgiaGermanyGhanaGreeceGrenadaGuatemalaHondurasHong Kong SAR, ChinaHungaryIcelandIndiaIndonesiaIran, Islamic Rep.IraqIrelandIsraelItalyJamaicaJapanJordanKazakhstanKenyaKiribatiKorea, Rep.KuwaitKyrgyz RepublicLao PDRLatviaLebanonLiberiaLithuaniaLuxembourgMacedonia, FYRMadagascarMalawiMalaysiaMaldivesMaliMaltaMauritiusMexicoMicronesia, Fed. Sts.MoldovaMongoliaMoroccoMozambiqueMyanmarNamibiaNepalNetherlandsNew ZealandNicaraguaNorwayOmanPakistanPanamaPapua New GuineaParaguayPeruPhilippinesPolandPortugalQatarRomaniaRussian FederationRwandaSamoaSan MarinoSao Tome and PrincipeSenegalSerbiaSeychellesSierra LeoneSingaporeSlovak RepublicSloveniaSolomon IslandsSouth AfricaSpainSri LankaSt. Kitts and NevisSt. LuciaSurinameSwazilandSwedenSwitzerlandSyrian Arab RepublicTajikistanTanzaniaThailandTogoTrinidad and TobagoTunisiaTurkeyUgandaUkraineUnited Arab EmiratesUnited KingdomUnited StatesUruguayVanuatuVenezuela, RBVietnamWest Bank and GazaYemen, Rep.ZambiaZimbabwe La ligne de temps
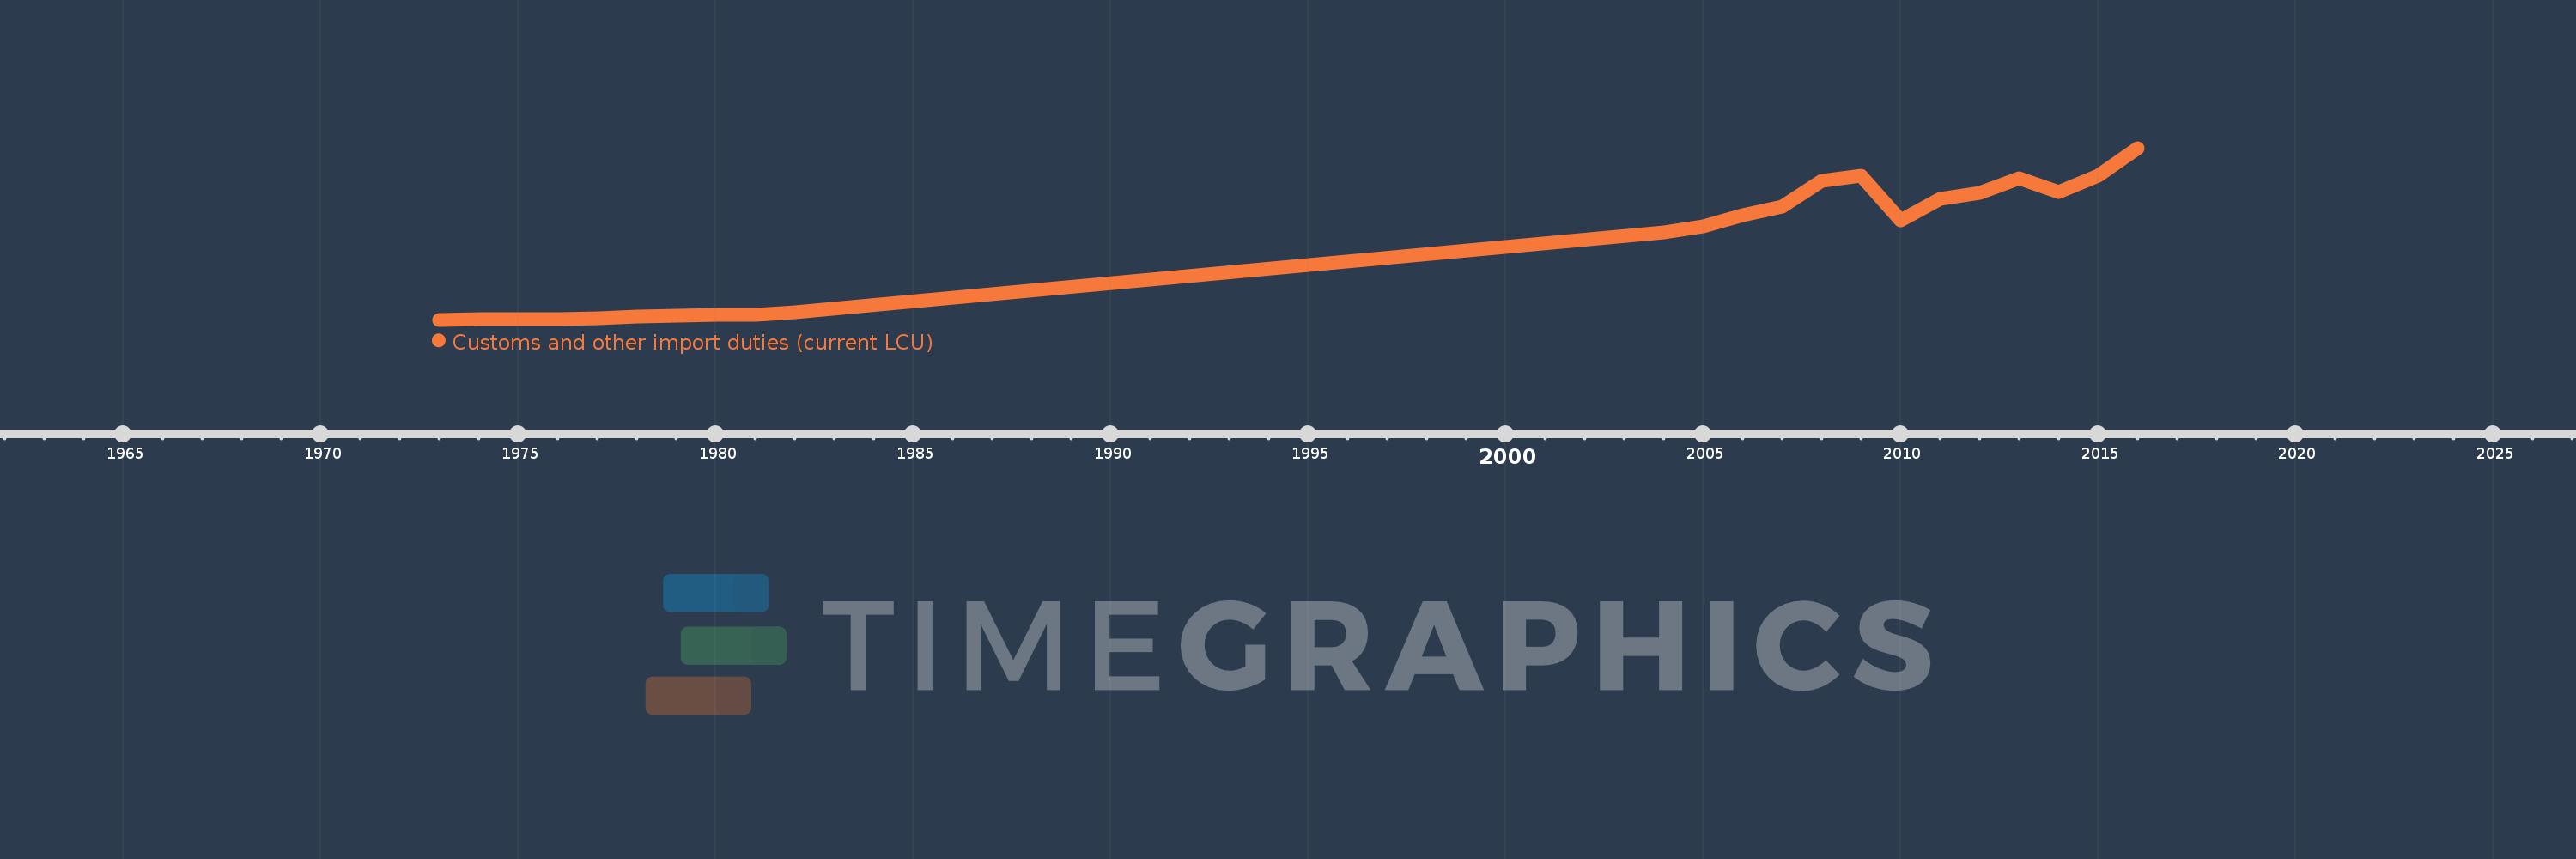
Cette échelle de temps montre un graphique de 1973 année à 2016 année Honduras. Les données jusqu'à 1972 année ne sont pas présentés. Quantité d'observations actuelles selon dates: 23.
Source (désignation):
Les indicateurs du développement mondiale
Source (organisation):
International Monetary Fund, Government Finance Statistics Yearbook and data files.
Catégories:
Public Sector
Dernière mise à jour
23 avr. 2017
Les indicateurs de changement de valeurs selon les années
Minimum:
51.7 mln.
1 janv. 1973
Maximum:
3.541 mds
1 janv. 2016
Pour la date d''observation
Valeur
Changement absolu
Le changement par rapport à la valeur précédente
1 janv. 1973
51.7 mln.
+51.7 mln.
0.0%
1 janv. 1974
56.2 mln.
+4.5 mln.
8.7%
1 janv. 1975
64.9 mln.
+8.7 mln.
15.48%
1 janv. 1976
61.7 mln.
-3.2 mln.
-4.93%
1 janv. 1977
80.2 mln.
+18.5 mln.
29.98%
1 janv. 1978
115.2 mln.
+35.0 mln.
43.64%
1 janv. 1979
128.7 mln.
+13.5 mln.
11.72%
1 janv. 1980
146.3 mln.
+17.6 mln.
13.68%
1 janv. 1981
149.7 mln.
+3.4 mln.
2.32%
1 janv. 1982
200.2 mln.
+50.5 mln.
33.73%
1 janv. 2004
1.833 mds
+1.632 mds
815.38%
1 janv. 2005
1.952 mds
+119.0 mln.
6.49%
1 janv. 2006
2.178 mds
+226.8 mln.
11.62%
1 janv. 2007
2.353 mds
+174.5 mln.
8.01%
1 janv. 2008
2.879 mds
+525.962 mln.
22.35%
1 janv. 2009
2.975 mds
+96.238 mln.
3.34%
1 janv. 2010
2.065 mds
-910.0 mln.
-30.59%
1 janv. 2011
2.505 mds
+440.0 mln.
21.31%
1 janv. 2012
2.626 mds
+121.1 mln.
4.83%
1 janv. 2013
2.933 mds
+306.3 mln.
11.66%
1 janv. 2014
2.651 mds
-281.385 mln.
-9.6%
1 janv. 2015
2.974 mds
+322.743 mln.
12.17%
1 janv. 2016
3.541 mds
+567.196 mln.
19.07%
Classement des pays selon les statistiques actuelles par années
Commentaires: