29
/fr/
fr
AIzaSyAYiBZKx7MnpbEhh9jyipgxe19OcubqV5w
April 1, 2024
215122
Oman
OMN
true
2
1
Customs and other import duties (current LCU)
2014,2013,2012,2011,2010,2009,2008,2007,2006,2005,2004,2003,2002,2001,2000,1999,1998,1997,1996,1995,1994,1993,1992,1991
Cette statistique dans les autres pays:
AfghanistanAlbaniaAlgeriaAngolaAntigua and BarbudaArgentinaArmeniaAustraliaAustriaAzerbaijanBahamas, TheBahrainBangladeshBarbadosBelarusBelizeBeninBhutanBoliviaBosnia and HerzegovinaBotswanaBrazilBulgariaBurkina FasoBurundiCabo VerdeCambodiaCentral African RepublicChileChinaColombiaCongo, Dem. Rep.Congo, Rep.Costa RicaCote d'IvoireCroatiaCyprusCzech RepublicDenmarkDominicaDominican RepublicEgypt, Arab Rep.El SalvadorEquatorial GuineaEstoniaEthiopiaFijiFinlandFranceGambia, TheGeorgiaGermanyGhanaGreeceGrenadaGuatemalaHondurasHong Kong SAR, ChinaHungaryIcelandIndiaIndonesiaIran, Islamic Rep.IraqIrelandIsraelItalyJamaicaJapanJordanKazakhstanKenyaKiribatiKorea, Rep.KuwaitKyrgyz RepublicLao PDRLatviaLebanonLiberiaLithuaniaLuxembourgMacedonia, FYRMadagascarMalawiMalaysiaMaldivesMaliMaltaMauritiusMexicoMicronesia, Fed. Sts.MoldovaMongoliaMoroccoMozambiqueMyanmarNamibiaNepalNetherlandsNew ZealandNicaraguaNorwayOmanPakistanPanamaPapua New GuineaParaguayPeruPhilippinesPolandPortugalQatarRomaniaRussian FederationRwandaSamoaSan MarinoSao Tome and PrincipeSenegalSerbiaSeychellesSierra LeoneSingaporeSlovak RepublicSloveniaSolomon IslandsSouth AfricaSpainSri LankaSt. Kitts and NevisSt. LuciaSurinameSwazilandSwedenSwitzerlandSyrian Arab RepublicTajikistanTanzaniaThailandTogoTrinidad and TobagoTunisiaTurkeyUgandaUkraineUnited Arab EmiratesUnited KingdomUnited StatesUruguayVanuatuVenezuela, RBVietnamWest Bank and GazaYemen, Rep.ZambiaZimbabwe La ligne de temps
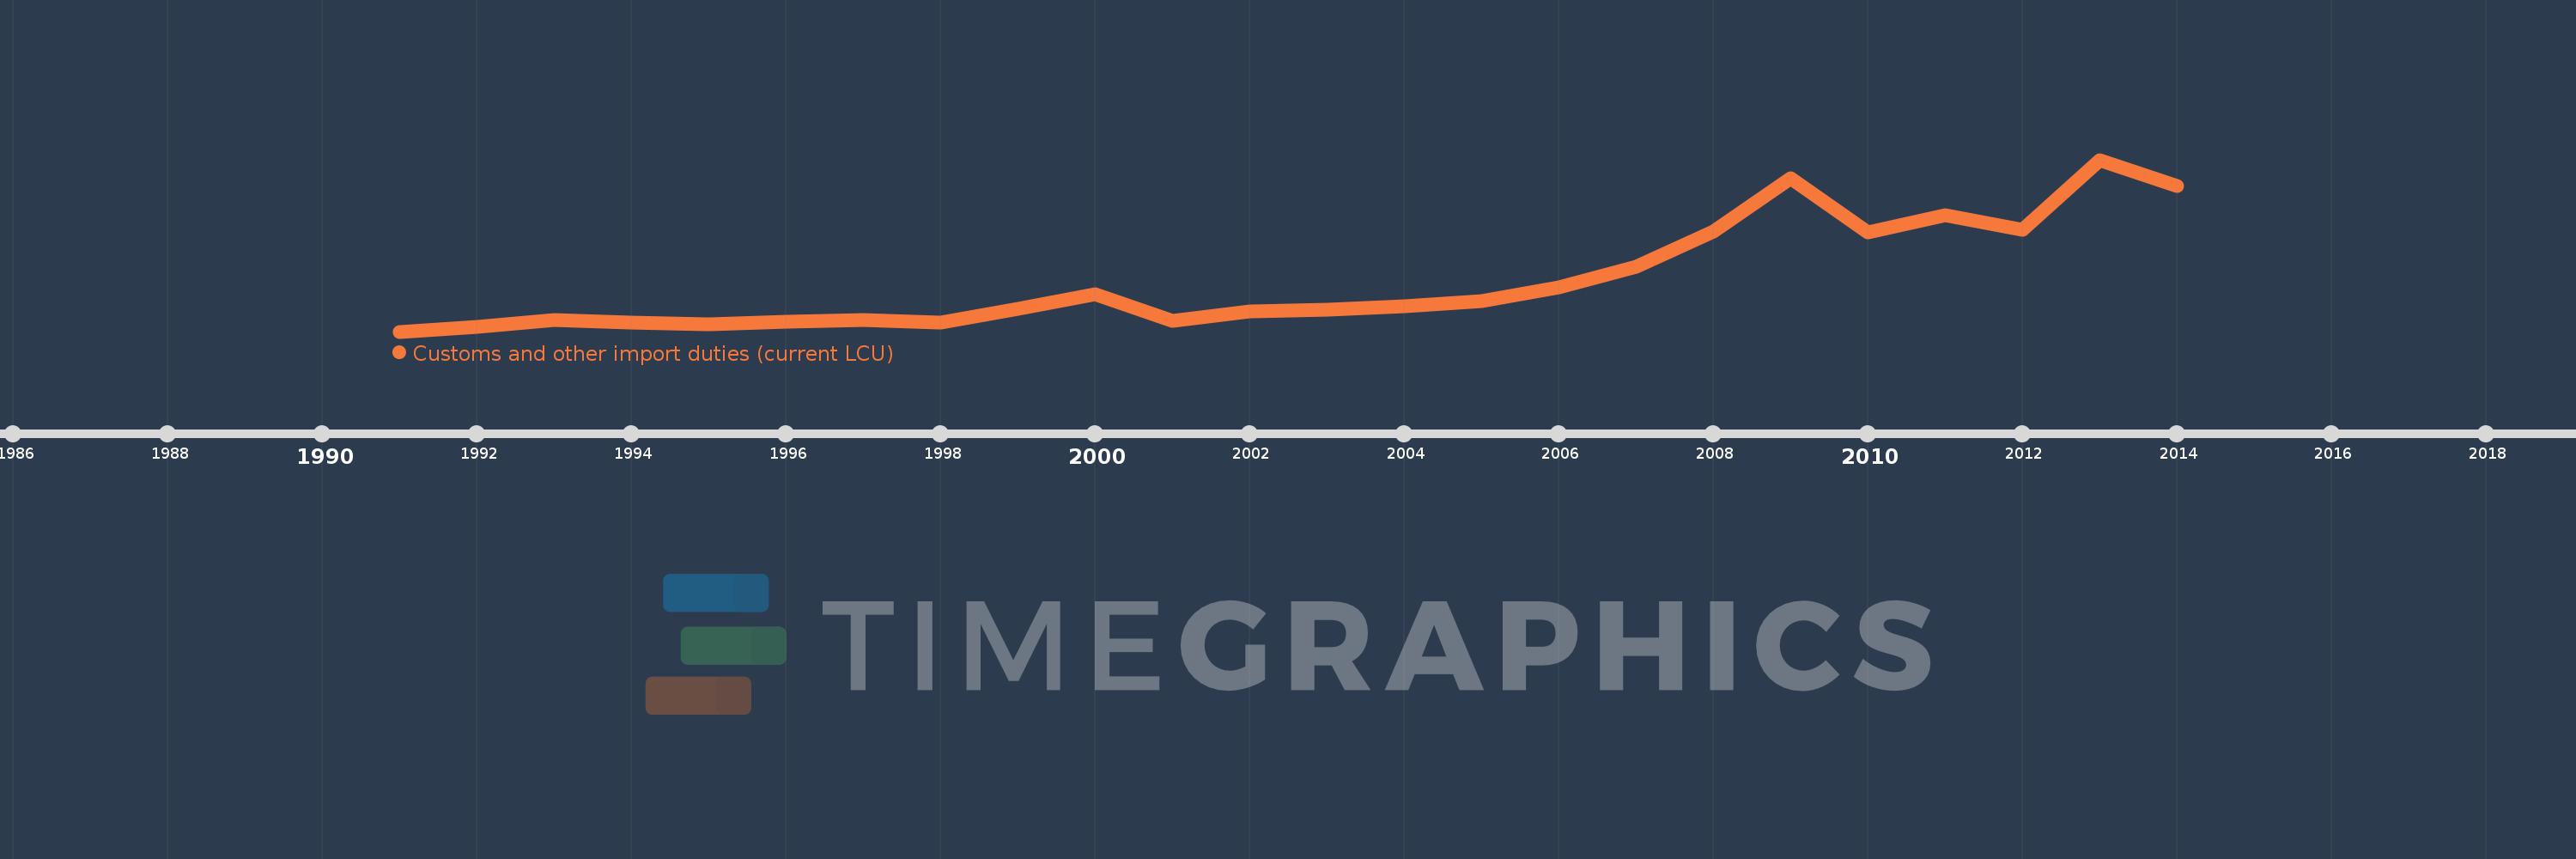
Cette échelle de temps montre un graphique de 1991 année à 2014 année Oman. Les données jusqu'à 1990 année ne sont pas présentés. Quantité d'observations actuelles selon dates: 24.
Source (désignation):
Les indicateurs du développement mondiale
Source (organisation):
International Monetary Fund, Government Finance Statistics Yearbook and data files.
Catégories:
Public Sector
Dernière mise à jour
23 avr. 2017
Les indicateurs de changement de valeurs selon les années
Minimum:
32.6 mln.
1 janv. 1991
Maximum:
250.1 mln.
1 janv. 2013
Pour la date d''observation
Valeur
Changement absolu
Le changement par rapport à la valeur précédente
1 janv. 1991
32.6 mln.
+32.6 mln.
0.0%
1 janv. 1992
38.9 mln.
+6.3 mln.
19.33%
1 janv. 1993
47.8 mln.
+8.9 mln.
22.88%
1 janv. 1994
43.6 mln.
-4.2 mln.
-8.79%
1 janv. 1995
41.5 mln.
-2.1 mln.
-4.82%
1 janv. 1996
45.3 mln.
+3.8 mln.
9.16%
1 janv. 1997
47.6 mln.
+2.3 mln.
5.08%
1 janv. 1998
43.8 mln.
-3.8 mln.
-7.98%
1 janv. 1999
61.7 mln.
+17.9 mln.
40.87%
1 janv. 2000
80.3 mln.
+18.6 mln.
30.15%
1 janv. 2001
46.1 mln.
-34.2 mln.
-42.59%
1 janv. 2002
58.6 mln.
+12.5 mln.
27.11%
1 janv. 2003
60.2 mln.
+1.6 mln.
2.73%
1 janv. 2004
65.0 mln.
+4.8 mln.
7.97%
1 janv. 2005
71.0 mln.
+6.0 mln.
9.23%
1 janv. 2006
88.5 mln.
+17.5 mln.
24.65%
1 janv. 2007
114.6 mln.
+26.1 mln.
29.49%
1 janv. 2008
159.6 mln.
+45.0 mln.
39.27%
1 janv. 2009
226.6 mln.
+67.0 mln.
41.98%
1 janv. 2010
158.1 mln.
-68.5 mln.
-30.23%
1 janv. 2011
179.6 mln.
+21.5 mln.
13.6%
1 janv. 2012
161.2 mln.
-18.4 mln.
-10.24%
1 janv. 2013
250.1 mln.
+88.9 mln.
55.15%
1 janv. 2014
217.3 mln.
-32.8 mln.
-13.11%
Classement des pays selon les statistiques actuelles par années
Commentaires: