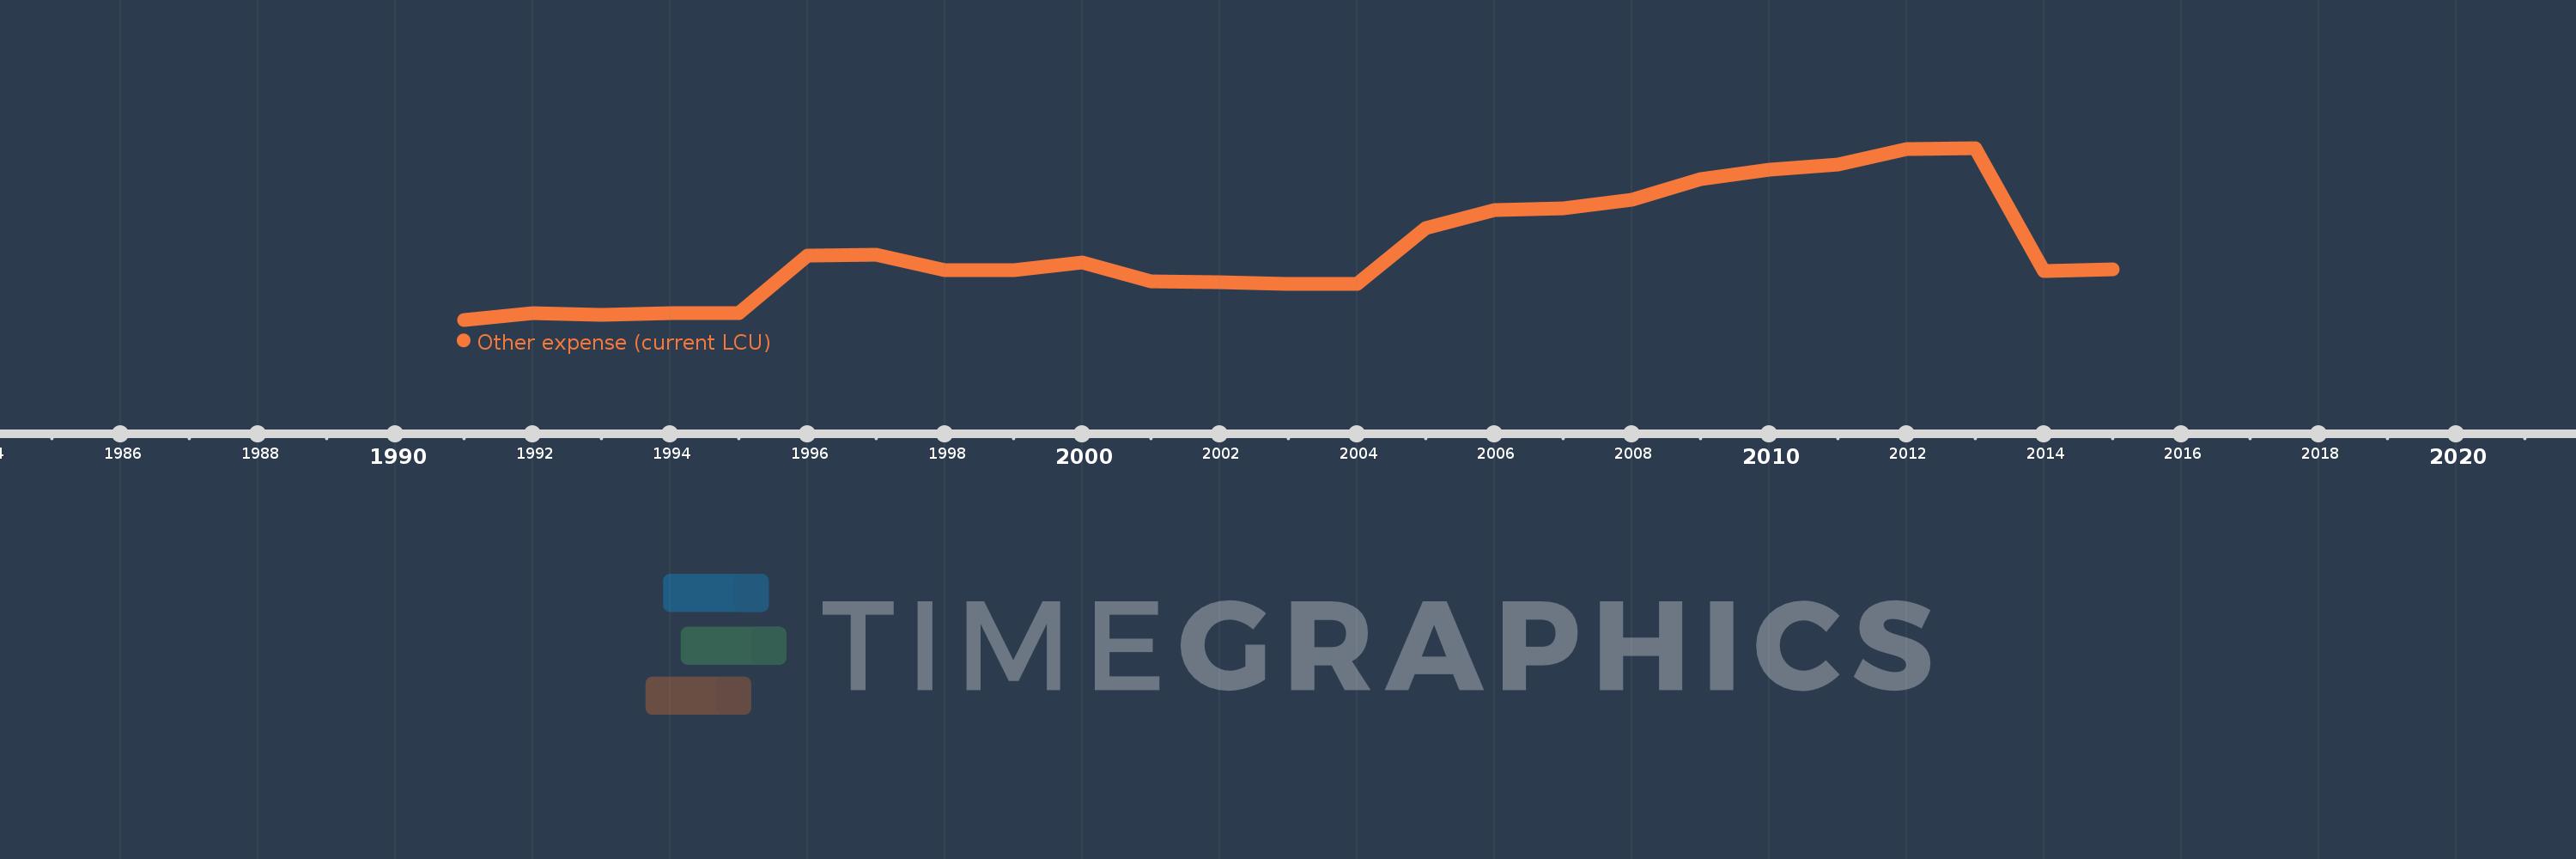
Cette échelle de temps montre un graphique de 1991 année à 2015 année Belgium. Les données jusqu'à 1990 année ne sont pas présentés. Quantité d'observations actuelles selon dates: 25.
Source (désignation):
Les indicateurs du développement mondiale
Source (organisation):
International Monetary Fund, Government Finance Statistics Yearbook and data files.
Catégories:
Public Sector
Dernière mise à jour
23 avr. 2017
Les indicateurs de changement de valeurs selon les années
En moyenne:
1.532 mds
Minimum:
190.5 mln.
1 janv. 1991
Maximum:
3.43 mds
1 janv. 2013
Pour la date d''observation
Valeur
Changement absolu
Le changement par rapport à la valeur précédente
1 janv. 1991
190.5 mln.
+190.5 mln.
0.0%
1 janv. 1992
311.6 mln.
+121.1 mln.
63.57%
1 janv. 1993
281.2 mln.
-30.4 mln.
-9.76%
1 janv. 1994
312.5 mln.
+31.3 mln.
11.13%
1 janv. 1995
317.5 mln.
+5.0 mln.
1.6%
1 janv. 1996
1.398 mds
+1.081 mds
340.44%
1 janv. 1997
1.419 mds
+20.5 mln.
1.47%
1 janv. 1998
1.117 mds
-301.8 mln.
-21.27%
1 janv. 1999
1.127 mds
+10.3 mln.
0.92%
1 janv. 2000
1.264 mds
+136.9 mln.
12.14%
1 janv. 2001
918.7 mln.
-345.6 mln.
-27.34%
1 janv. 2002
891.1 mln.
-27.6 mln.
-3.0%
1 janv. 2003
868.1 mln.
-23.0 mln.
-2.58%
1 janv. 2004
862.1 mln.
-6.0 mln.
-0.69%
1 janv. 2005
1.917 mds
+1.054 mds
122.32%
1 janv. 2006
2.266 mds
+349.4 mln.
18.23%
1 janv. 2007
2.297 mds
+31.2 mln.
1.38%
1 janv. 2008
2.449 mds
+151.8 mln.
6.61%
1 janv. 2009
2.85 mds
+400.6 mln.
16.36%
1 janv. 2010
3.019 mds
+169.5 mln.
5.95%
1 janv. 2011
3.118 mds
+98.8 mln.
3.27%
1 janv. 2012
3.408 mds
+289.6 mln.
9.29%
1 janv. 2013
3.43 mds
+22.1 mln.
0.65%
1 janv. 2014
1.116 mds
-2.313 mds
-67.45%
1 janv. 2015
1.148 mds
+32.0 mln.
2.87%
Classement des pays selon les statistiques actuelles par années