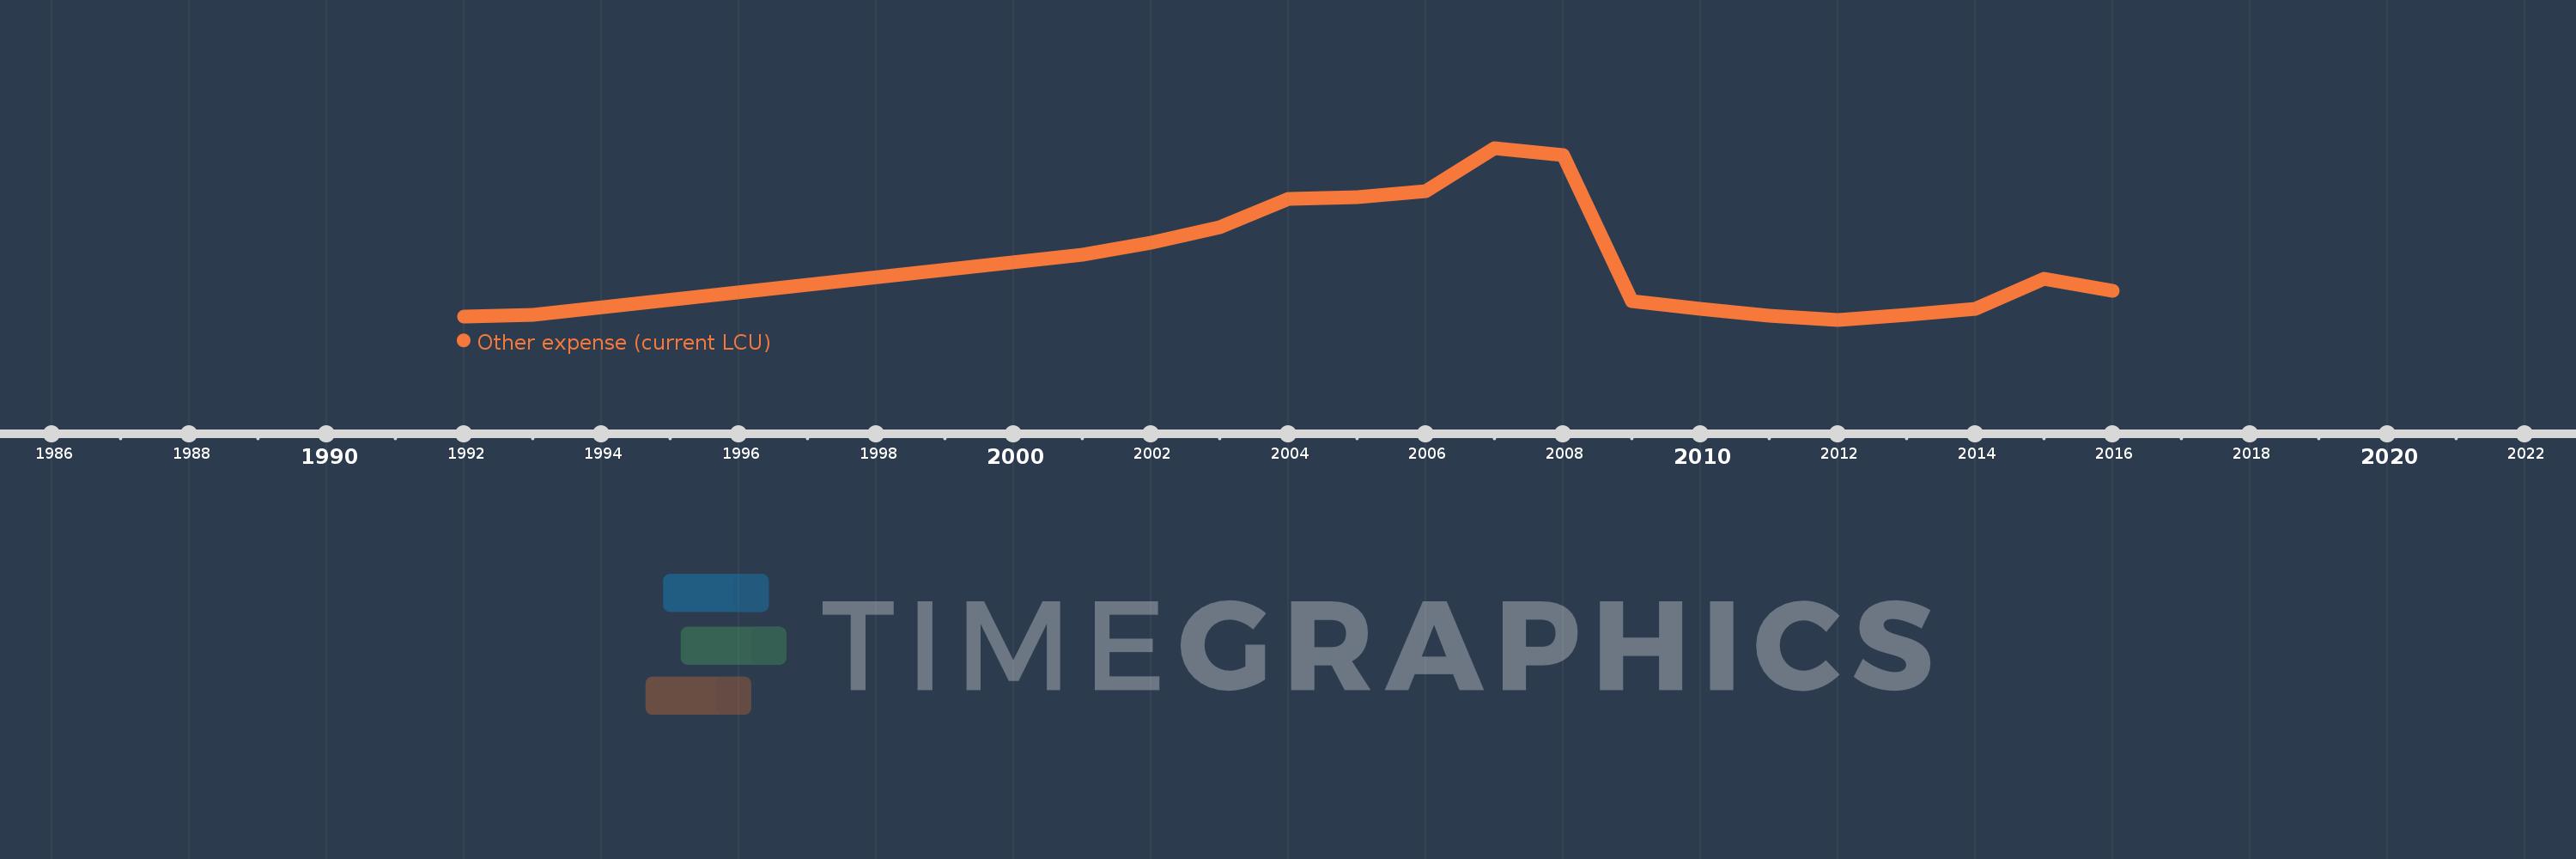
Cette échelle de temps montre un graphique de 1992 année à 2016 année Namibia. Les données jusqu'à 1991 année ne sont pas présentés. Quantité d'observations actuelles selon dates: 18.
Source (désignation):
Les indicateurs du développement mondiale
Source (organisation):
International Monetary Fund, Government Finance Statistics Yearbook and data files.
Catégories:
Public Sector
Dernière mise à jour
23 avr. 2017
Les indicateurs de changement de valeurs selon les années
En moyenne:
783.198 mln.
Minimum:
50.0 mln.
1 janv. 2012
Maximum:
2.166 mds
1 janv. 2007
Pour la date d''observation
Valeur
Changement absolu
Le changement par rapport à la valeur précédente
1 janv. 1992
91.7 mln.
+91.7 mln.
0.0%
1 janv. 1993
109.3 mln.
+17.6 mln.
19.19%
1 janv. 2001
851.653 mln.
+742.353 mln.
679.19%
1 janv. 2002
1.001 mds
+149.045 mln.
17.5%
1 janv. 2003
1.192 mds
+191.032 mln.
19.09%
1 janv. 2004
1.542 mds
+350.125 mln.
29.38%
1 janv. 2005
1.562 mds
+20.385 mln.
1.32%
1 janv. 2006
1.63 mds
+68.015 mln.
4.35%
1 janv. 2007
2.166 mds
+535.812 mln.
32.87%
1 janv. 2008
2.073 mds
-92.592 mln.
-4.27%
1 janv. 2009
282.837 mln.
-1.791 mds
-86.36%
1 janv. 2010
184.354 mln.
-98.483 mln.
-34.82%
1 janv. 2011
98.194 mln.
-86.16 mln.
-46.74%
1 janv. 2012
50.0 mln.
-48.194 mln.
-49.08%
1 janv. 2013
114.514 mln.
+64.514 mln.
129.03%
1 janv. 2014
183.945 mln.
+69.43 mln.
60.63%
1 janv. 2015
558.975 mln.
+375.03 mln.
203.88%
1 janv. 2016
405.774 mln.
-153.201 mln.
-27.41%
Classement des pays selon les statistiques actuelles par années