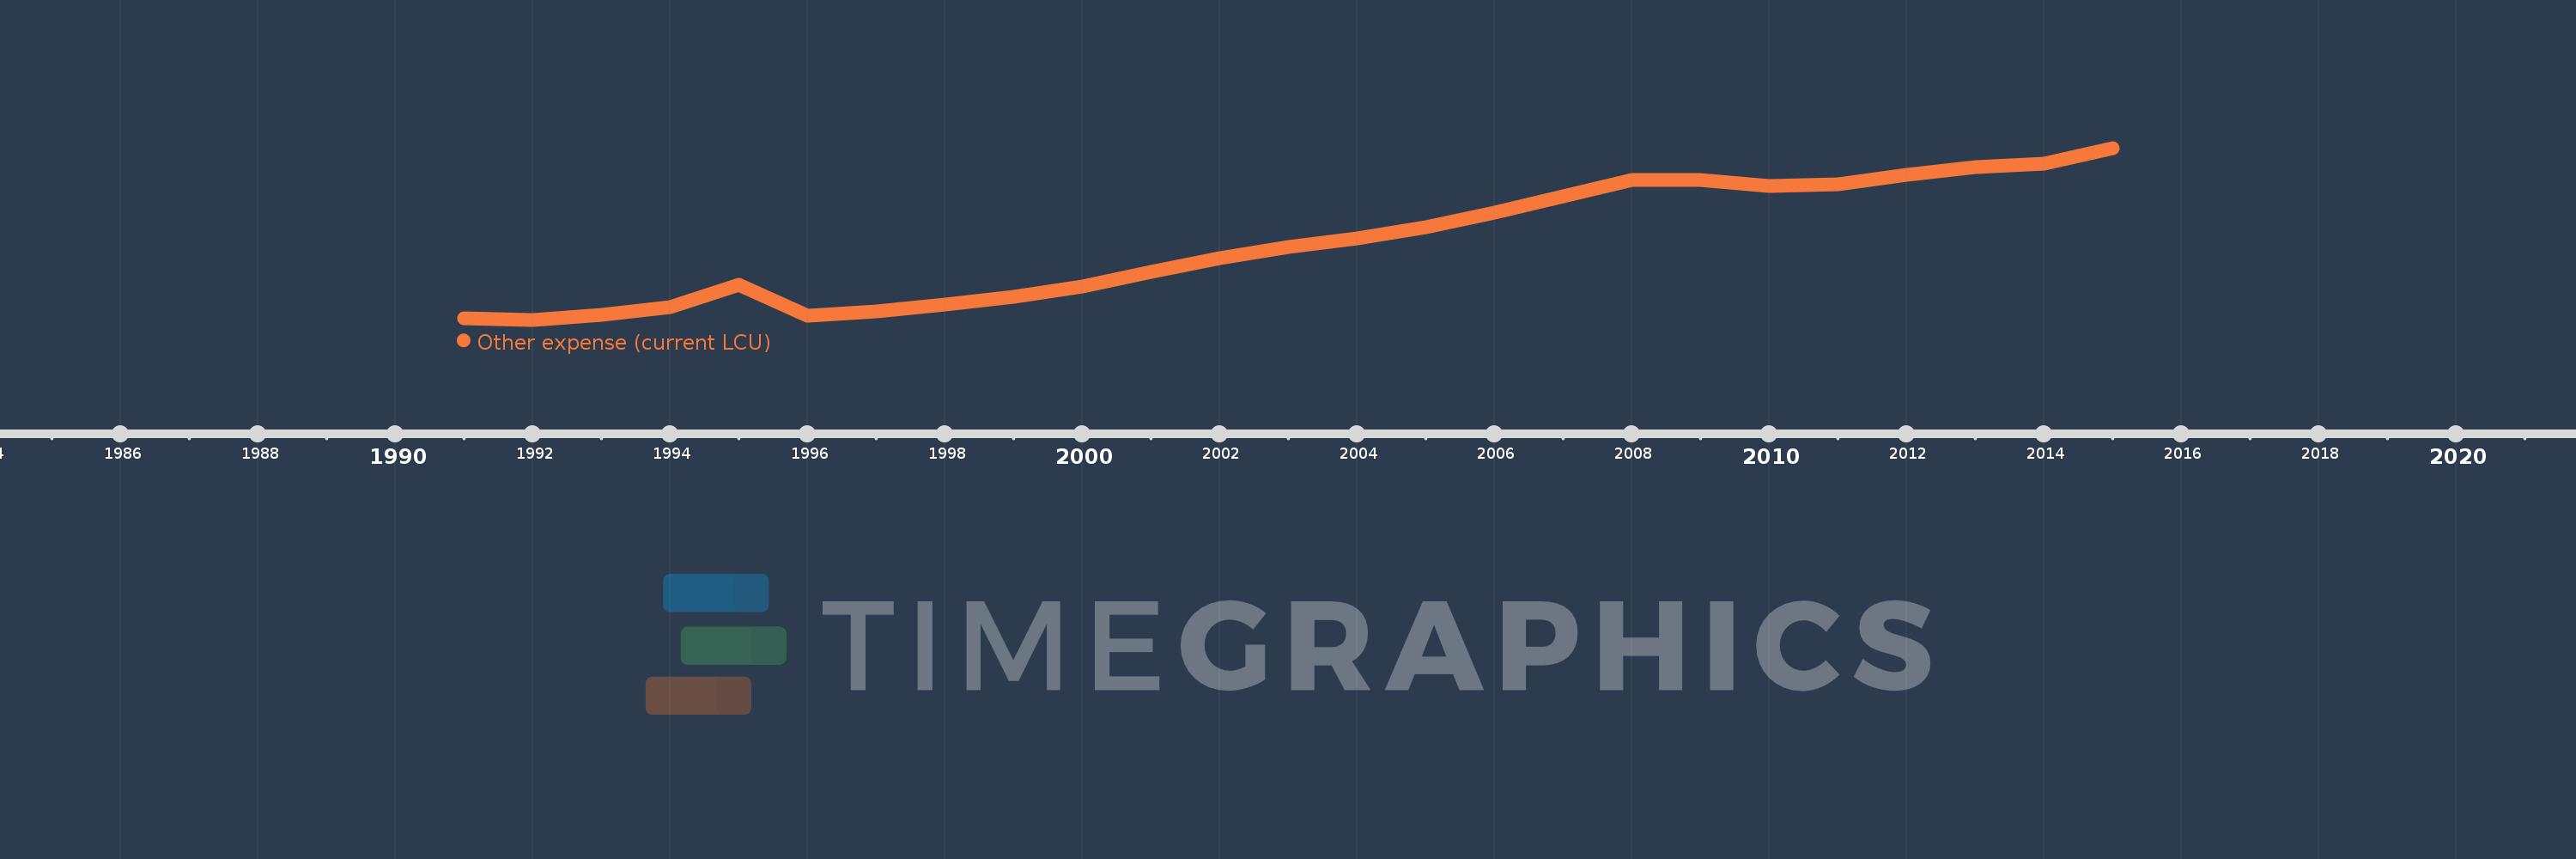
Cette échelle de temps montre un graphique de 1991 année à 2015 année Ireland. Les données jusqu'à 1990 année ne sont pas présentés. Quantité d'observations actuelles selon dates: 25.
Source (désignation):
Les indicateurs du développement mondiale
Source (organisation):
International Monetary Fund, Government Finance Statistics Yearbook and data files.
Catégories:
Public Sector
Dernière mise à jour
23 avr. 2017
Les indicateurs de changement de valeurs selon les années
En moyenne:
921.057 mln.
Minimum:
339.02 mln.
1 janv. 1992
Maximum:
1.657 mds
1 janv. 2015
Pour la date d''observation
Valeur
Changement absolu
Le changement par rapport à la valeur précédente
1 janv. 1991
349.178 mln.
+349.178 mln.
0.0%
1 janv. 1992
339.02 mln.
-10.158 mln.
-2.91%
1 janv. 1993
374.573 mln.
+35.553 mln.
10.49%
1 janv. 1994
434.25 mln.
+59.678 mln.
15.93%
1 janv. 1995
608.205 mln.
+173.954 mln.
40.06%
1 janv. 1996
369.59 mln.
-238.615 mln.
-39.23%
1 janv. 1997
404.41 mln.
+34.82 mln.
9.42%
1 janv. 1998
456.05 mln.
+51.64 mln.
12.77%
1 janv. 1999
514.18 mln.
+58.13 mln.
12.75%
1 janv. 2000
592.83 mln.
+78.65 mln.
15.3%
1 janv. 2001
705.11 mln.
+112.28 mln.
18.94%
1 janv. 2002
814.54 mln.
+109.43 mln.
15.52%
1 janv. 2003
893.94 mln.
+79.4 mln.
9.75%
1 janv. 2004
959.77 mln.
+65.83 mln.
7.36%
1 janv. 2005
1.046 mds
+86.63 mln.
9.03%
1 janv. 2006
1.16 mds
+113.39 mln.
10.84%
1 janv. 2007
1.287 mds
+127.11 mln.
10.96%
1 janv. 2008
1.41 mds
+123.42 mln.
9.59%
1 janv. 2009
1.409 mds
-1.64 mln.
-0.12%
1 janv. 2010
1.366 mds
-43.02 mln.
-3.05%
1 janv. 2011
1.38 mds
+14.64 mln.
1.07%
1 janv. 2012
1.449 mds
+69.09 mln.
5.01%
1 janv. 2013
1.51 mds
+61.01 mln.
4.21%
1 janv. 2014
1.536 mds
+25.82 mln.
1.71%
1 janv. 2015
1.657 mds
+120.5 mln.
7.84%
Classement des pays selon les statistiques actuelles par années