33
/fr/
AIzaSyAYiBZKx7MnpbEhh9jyipgxe19OcubqV5w
May 1, 2025
81157
Belarus
BLR
true
2
1
Primary income payments (BoP, current US$)
2016,2015,2014,2013,2012,2011,2010,2009,2008,2007,2006,2005,2004,2003,2002,2001,2000,1999,1998,1997,1996,1995,1994
Download
Bibliothèque de statistiques globales →Belarus →

Primary income payments (BoP, current US$)

Cette statistique dans les autres pays:

AfghanistanAlbaniaAlgeriaAngolaAntigua and BarbudaArab WorldArgentinaArmeniaArubaAustraliaAustriaAzerbaijanBahamas, TheBahrainBangladeshBarbadosBelarusBelgiumBelizeBeninBermudaBhutanBoliviaBosnia and HerzegovinaBotswanaBrazilBrunei DarussalamBulgariaBurkina FasoBurundiCabo VerdeCambodiaCameroonCanadaCaribbean small statesCentral African RepublicCentral Europe and the BalticsChadChileChinaColombiaComorosCongo, Dem. Rep.Congo, Rep.Costa RicaCote d'IvoireCroatiaCuracaoCyprusCzech RepublicDenmarkDjiboutiDominicaDominican RepublicEarly-demographic dividendEast Asia & PacificEast Asia & Pacific (excluding high income)East Asia & Pacific (IDA & IBRD countries)EcuadorEgypt, Arab Rep.El SalvadorEquatorial GuineaEritreaEstoniaEthiopiaEuro areaEurope & Central AsiaEurope & Central Asia (excluding high income)Europe & Central Asia (IDA & IBRD countries)European UnionFaroe IslandsFijiFinlandFragile and conflict affected situationsFranceFrench PolynesiaGabonGambia, TheGeorgiaGermanyGhanaGreeceGrenadaGuatemalaGuineaGuinea-BissauGuyanaHaitiHeavily indebted poor countries (HIPC)High incomeHondurasHong Kong SAR, ChinaHungaryIBRD onlyIcelandIDA & IBRD totalIDA blendIDA onlyIDA totalIndiaIndonesiaIran, Islamic Rep.IraqIrelandIsraelItalyJamaicaJapanJordanKazakhstanKenyaKiribatiKorea, Rep.KosovoKuwaitKyrgyz RepublicLao PDRLate-demographic dividendLatin America & Caribbean Latin America & Caribbean (excluding high income)Latin America & the Caribbean (IDA & IBRD countries)LatviaLeast developed countries: UN classificationLebanonLesothoLiberiaLibyaLithuaniaLow & middle incomeLow incomeLower middle incomeLuxembourgMacao SAR, ChinaMacedonia, FYRMadagascarMalawiMalaysiaMaldivesMaliMaltaMarshall IslandsMauritaniaMauritiusMexicoMicronesia, Fed. Sts.Middle East & North AfricaMiddle East & North Africa (excluding high income)Middle East & North Africa (IDA & IBRD countries)Middle incomeMoldovaMongoliaMontenegroMoroccoMozambiqueMyanmarNamibiaNepalNetherlandsNew CaledoniaNew ZealandNicaraguaNigerNigeriaNorth AmericaNorwayOECD membersOmanOther small statesPacific island small statesPakistanPalauPanamaPapua New GuineaParaguayPeruPhilippinesPolandPortugalPost-demographic dividendPre-demographic dividendQatarRomaniaRussian FederationRwandaSamoaSao Tome and PrincipeSaudi ArabiaSenegalSerbiaSeychellesSierra LeoneSingaporeSint Maarten (Dutch part)Slovak RepublicSloveniaSmall statesSolomon IslandsSouth AfricaSouth AsiaSouth Asia (IDA & IBRD)South SudanSpainSri LankaSt. Kitts and NevisSt. LuciaSt. Vincent and the GrenadinesSub-Saharan Africa Sub-Saharan Africa (excluding high income)Sub-Saharan Africa (IDA & IBRD countries)SudanSurinameSwazilandSwedenSwitzerlandSyrian Arab RepublicTajikistanTanzaniaThailandTimor-LesteTogoTongaTrinidad and TobagoTunisiaTurkeyTuvaluUgandaUkraineUnited KingdomUnited StatesUpper middle incomeUruguayVanuatuVenezuela, RBVietnamWest Bank and GazaWorldYemen, Rep.ZambiaZimbabwe

La ligne de temps

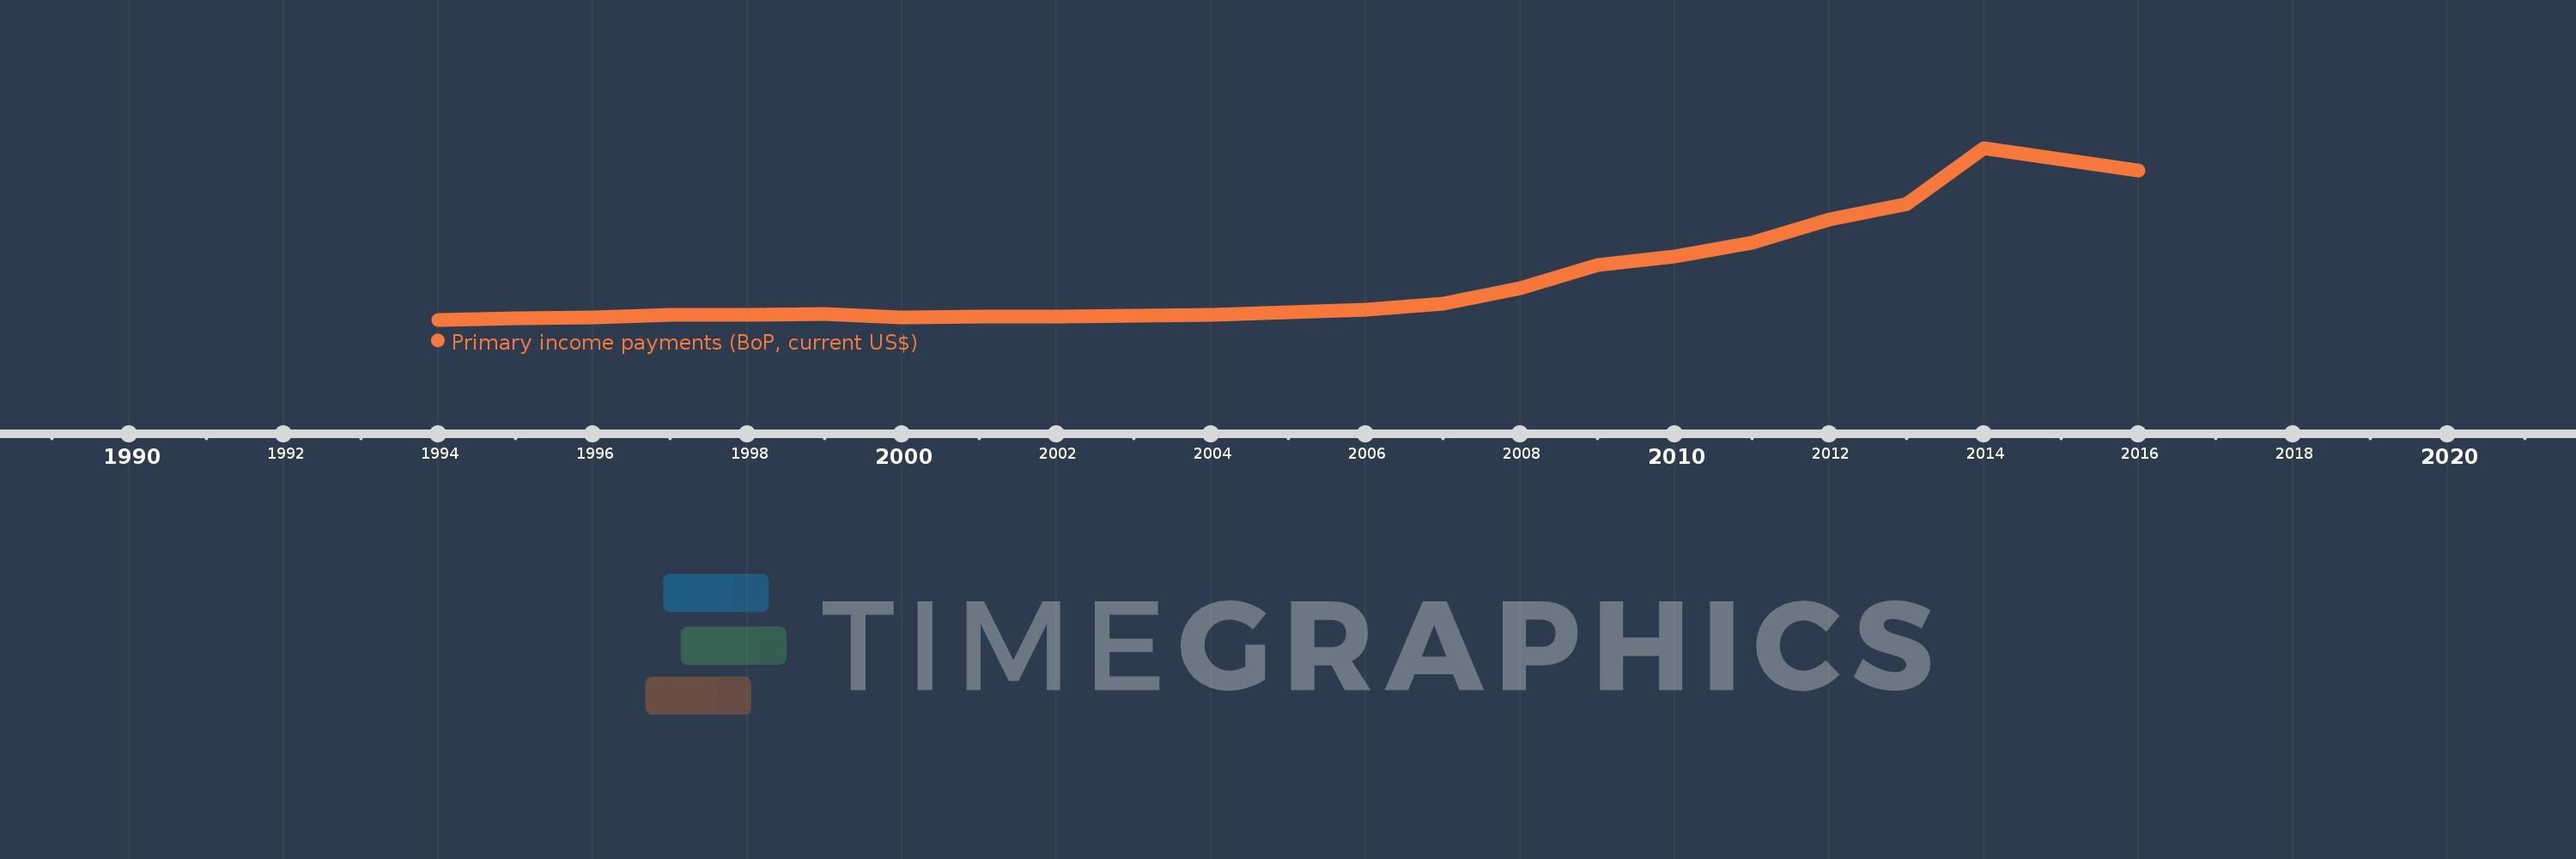
Cette échelle de temps montre un graphique de 1994 année à 2016 année Belarus. Les données jusqu'à 1993 année ne sont pas présentés. Quantité d'observations actuelles selon dates: 23.

Source (désignation):

Les indicateurs du développement mondiale

Source (organisation):

International Monetary Fund, Balance of Payments Statistics Yearbook and data files.

Catégories:

Economy & Growth

Dernière mise à jour

23 avr. 2017

Les indicateurs de changement de valeurs selon les années

En moyenne:
898.404 mln.
Minimum:
7.5 mln.
1 janv. 1994
Maximum:
3.543 mds
1 janv. 2014
Pour la date d''observation
Valeur
Changement absolu
Le changement par rapport à la valeur précédente
1 janv. 1994
7.5 mln.
+7.5 mln.
0.0%
1 janv. 1995
29.3 mln.
+21.8 mln.
290.67%
1 janv. 1996
52.9 mln.
+23.6 mln.
80.55%
1 janv. 1997
104.9 mln.
+52.0 mln.
98.3%
1 janv. 1998
115.8 mln.
+10.9 mln.
10.39%
1 janv. 1999
119.7 mln.
+3.9 mln.
3.37%
1 janv. 2000
62.8 mln.
-56.9 mln.
-47.54%
1 janv. 2001
72.4 mln.
+9.6 mln.
15.29%
1 janv. 2002
75.9 mln.
+3.5 mln.
4.83%
1 janv. 2003
96.6 mln.
+20.7 mln.
27.27%
1 janv. 2004
112.1 mln.
+15.5 mln.
16.05%
1 janv. 2005
158.5 mln.
+46.4 mln.
41.39%
1 janv. 2006
216.1 mln.
+57.6 mln.
36.34%
1 janv. 2007
346.3 mln.
+130.2 mln.
60.25%
1 janv. 2008
662.2 mln.
+315.9 mln.
91.22%
1 janv. 2009
1.137 mds
+475.3 mln.
71.78%
1 janv. 2010
1.306 mds
+168.6 mln.
14.82%
1 janv. 2011
1.6 mds
+293.8 mln.
22.49%
1 janv. 2012
2.066 mds
+466.5 mln.
29.16%
1 janv. 2013
2.39 mds
+323.5 mln.
15.66%
1 janv. 2014
3.543 mds
+1.153 mds
48.27%
1 janv. 2015
3.315 mds
-228.7 mln.
-6.45%
1 janv. 2016
3.072 mds
-242.3 mln.
-7.31%

Classement des pays selon les statistiques actuelles par années