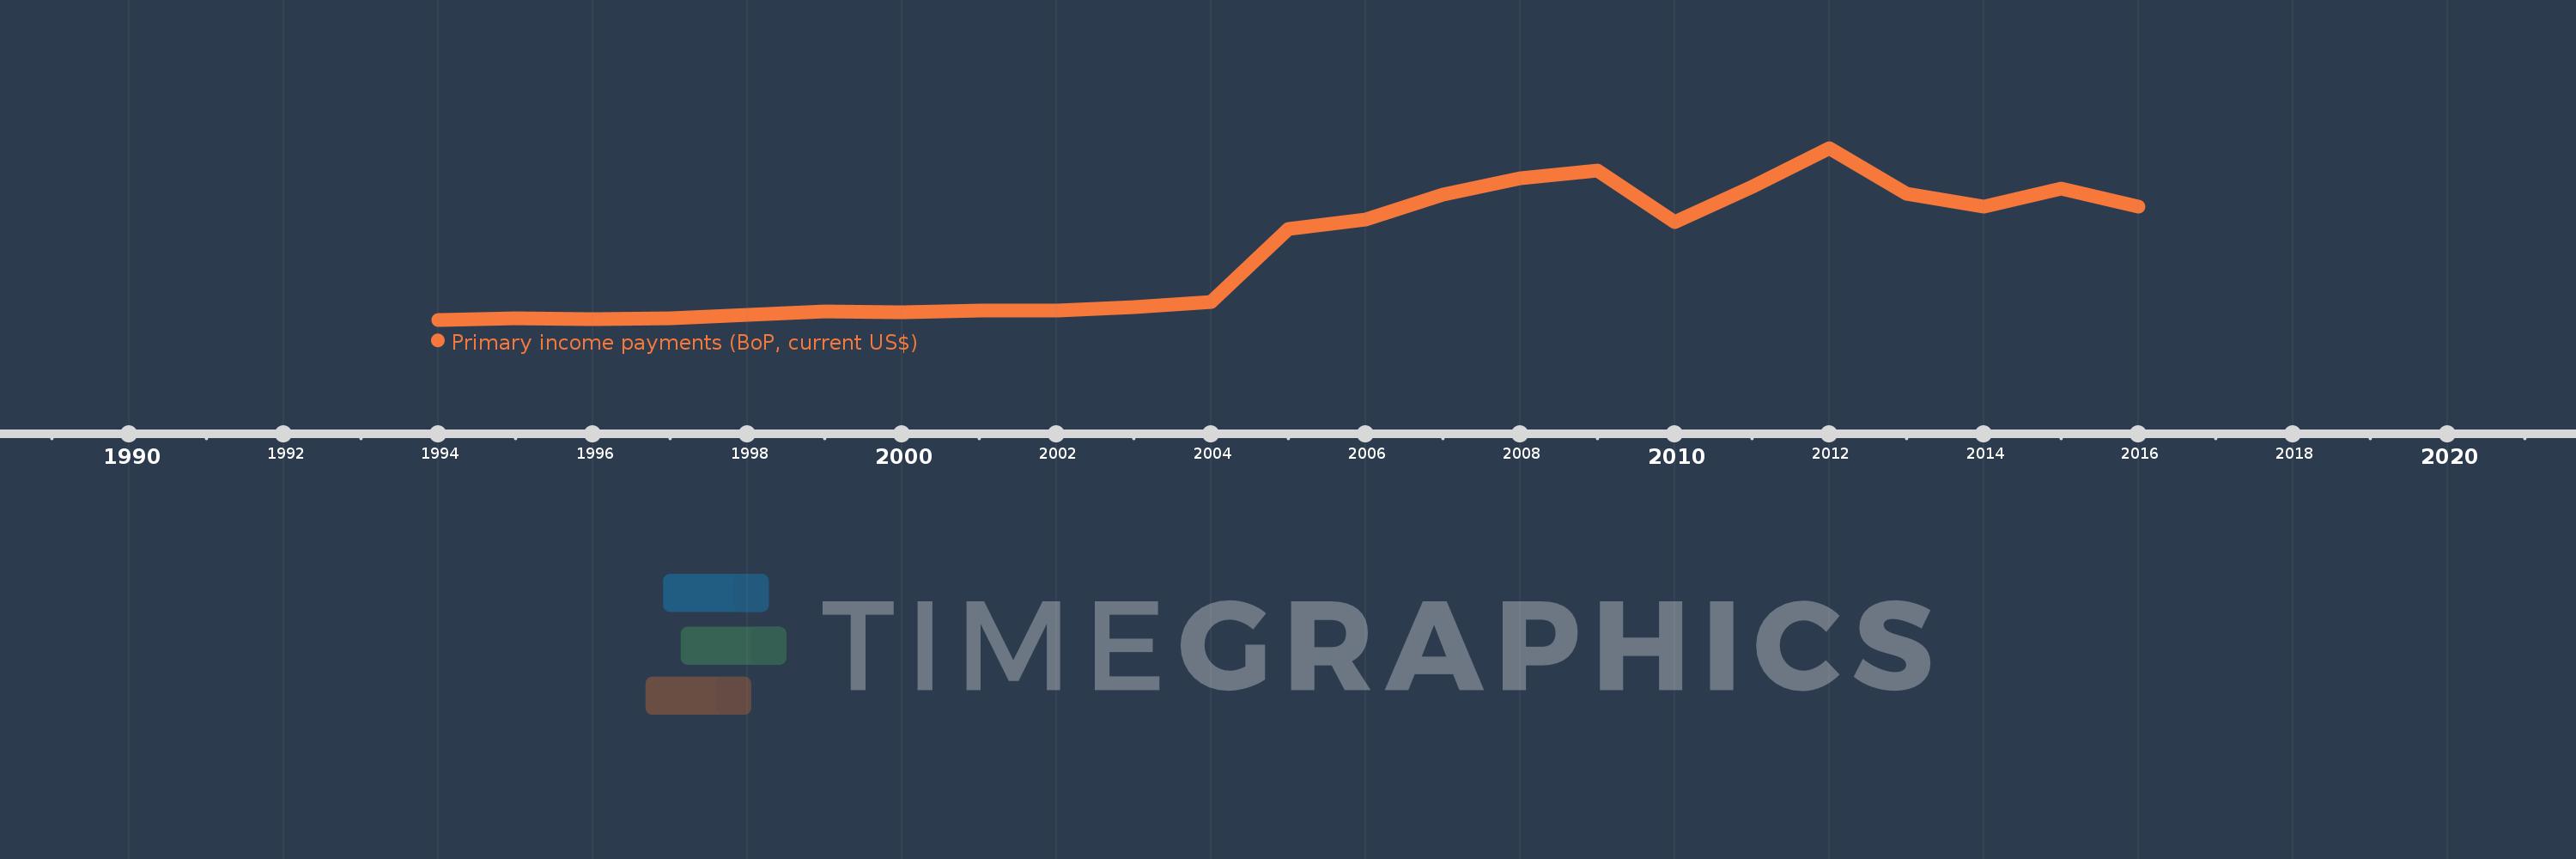
Cette échelle de temps montre un graphique de 1994 année à 2016 année Slovak Republic. Les données jusqu'à 1993 année ne sont pas présentés. Quantité d'observations actuelles selon dates: 23.
Source (désignation):
Les indicateurs du développement mondiale
Source (organisation):
International Monetary Fund, Balance of Payments Statistics Yearbook and data files.
Catégories:
Economy & Growth
Dernière mise à jour
23 avr. 2017
Les indicateurs de changement de valeurs selon les années
En moyenne:
3.256 mds
Minimum:
223.508 mln.
1 janv. 1994
Maximum:
7.879 mds
1 janv. 2012
Pour la date d''observation
Valeur
Changement absolu
Le changement par rapport à la valeur précédente
1 janv. 1994
223.508 mln.
+223.508 mln.
0.0%
1 janv. 1995
275.424 mln.
+51.916 mln.
23.23%
1 janv. 1996
263.454 mln.
-11.97 mln.
-4.35%
1 janv. 1997
270.291 mln.
+6.837 mln.
2.6%
1 janv. 1998
438.405 mln.
+168.114 mln.
62.2%
1 janv. 1999
595.313 mln.
+156.908 mln.
35.79%
1 janv. 2000
567.751 mln.
-27.562 mln.
-4.63%
1 janv. 2001
623.078 mln.
+55.327 mln.
9.74%
1 janv. 2002
630.341 mln.
+7.263 mln.
1.17%
1 janv. 2003
790.548 mln.
+160.207 mln.
25.42%
1 janv. 2004
1.026 mds
+235.657 mln.
29.81%
1 janv. 2005
4.257 mds
+3.23 mds
314.79%
1 janv. 2006
4.708 mds
+451.724 mln.
10.61%
1 janv. 2007
5.801 mds
+1.093 mds
23.21%
1 janv. 2008
6.518 mds
+716.827 mln.
12.36%
1 janv. 2009
6.885 mds
+367.47 mln.
5.64%
1 janv. 2010
4.559 mds
-2.327 mds
-33.79%
1 janv. 2011
6.164 mds
+1.605 mds
35.21%
1 janv. 2012
7.879 mds
+1.715 mds
27.82%
1 janv. 2013
5.824 mds
-2.055 mds
-26.09%
1 janv. 2014
5.253 mds
-571.347 mln.
-9.81%
1 janv. 2015
6.072 mds
+819.609 mln.
15.6%
1 janv. 2016
5.253 mds
-819.586 mln.
-13.5%
Classement des pays selon les statistiques actuelles par années