29
/fr/
fr
AIzaSyAYiBZKx7MnpbEhh9jyipgxe19OcubqV5w
April 1, 2024
64026
Afghanistan
AFG
true
2
1
Primary income payments (BoP, current US$)
2016,2015,2014,2013,2012,2011,2010,2009,1990,1989,1988,1987,1986,1985,1984,1983,1982,1981,1980
Download
Bibliothèque de statistiques globales →Afghanistan →

Primary income payments (BoP, current US$)

Cette statistique dans les autres pays:
AfghanistanAlbaniaAlgeriaAngolaAntigua and BarbudaArab WorldArgentinaArmeniaArubaAustraliaAustriaAzerbaijanBahamas, TheBahrainBangladeshBarbadosBelarusBelgiumBelizeBeninBermudaBhutanBoliviaBosnia and HerzegovinaBotswanaBrazilBrunei DarussalamBulgariaBurkina FasoBurundiCabo VerdeCambodiaCameroonCanadaCaribbean small statesCentral African RepublicCentral Europe and the BalticsChadChileChinaColombiaComorosCongo, Dem. Rep.Congo, Rep.Costa RicaCote d'IvoireCroatiaCuracaoCyprusCzech RepublicDenmarkDjiboutiDominicaDominican RepublicEarly-demographic dividendEast Asia & PacificEast Asia & Pacific (excluding high income)East Asia & Pacific (IDA & IBRD countries)EcuadorEgypt, Arab Rep.El SalvadorEquatorial GuineaEritreaEstoniaEthiopiaEuro areaEurope & Central AsiaEurope & Central Asia (excluding high income)Europe & Central Asia (IDA & IBRD countries)European UnionFaroe IslandsFijiFinlandFragile and conflict affected situationsFranceFrench PolynesiaGabonGambia, TheGeorgiaGermanyGhanaGreeceGrenadaGuatemalaGuineaGuinea-BissauGuyanaHaitiHeavily indebted poor countries (HIPC)High incomeHondurasHong Kong SAR, ChinaHungaryIBRD onlyIcelandIDA & IBRD totalIDA blendIDA onlyIDA totalIndiaIndonesiaIran, Islamic Rep.IraqIrelandIsraelItalyJamaicaJapanJordanKazakhstanKenyaKiribatiKorea, Rep.KosovoKuwaitKyrgyz RepublicLao PDRLate-demographic dividendLatin America & Caribbean Latin America & Caribbean (excluding high income)Latin America & the Caribbean (IDA & IBRD countries)LatviaLeast developed countries: UN classificationLebanonLesothoLiberiaLibyaLithuaniaLow & middle incomeLow incomeLower middle incomeLuxembourgMacao SAR, ChinaMacedonia, FYRMadagascarMalawiMalaysiaMaldivesMaliMaltaMarshall IslandsMauritaniaMauritiusMexicoMicronesia, Fed. Sts.Middle East & North AfricaMiddle East & North Africa (excluding high income)Middle East & North Africa (IDA & IBRD countries)Middle incomeMoldovaMongoliaMontenegroMoroccoMozambiqueMyanmarNamibiaNepalNetherlandsNew CaledoniaNew ZealandNicaraguaNigerNigeriaNorth AmericaNorwayOECD membersOmanOther small statesPacific island small statesPakistanPalauPanamaPapua New GuineaParaguayPeruPhilippinesPolandPortugalPost-demographic dividendPre-demographic dividendQatarRomaniaRussian FederationRwandaSamoaSao Tome and PrincipeSaudi ArabiaSenegalSerbiaSeychellesSierra LeoneSingaporeSint Maarten (Dutch part)Slovak RepublicSloveniaSmall statesSolomon IslandsSouth AfricaSouth AsiaSouth Asia (IDA & IBRD)South SudanSpainSri LankaSt. Kitts and NevisSt. LuciaSt. Vincent and the GrenadinesSub-Saharan Africa Sub-Saharan Africa (excluding high income)Sub-Saharan Africa (IDA & IBRD countries)SudanSurinameSwazilandSwedenSwitzerlandSyrian Arab RepublicTajikistanTanzaniaThailandTimor-LesteTogoTongaTrinidad and TobagoTunisiaTurkeyTuvaluUgandaUkraineUnited KingdomUnited StatesUpper middle incomeUruguayVanuatuVenezuela, RBVietnamWest Bank and GazaWorldYemen, Rep.ZambiaZimbabwe
La ligne de temps
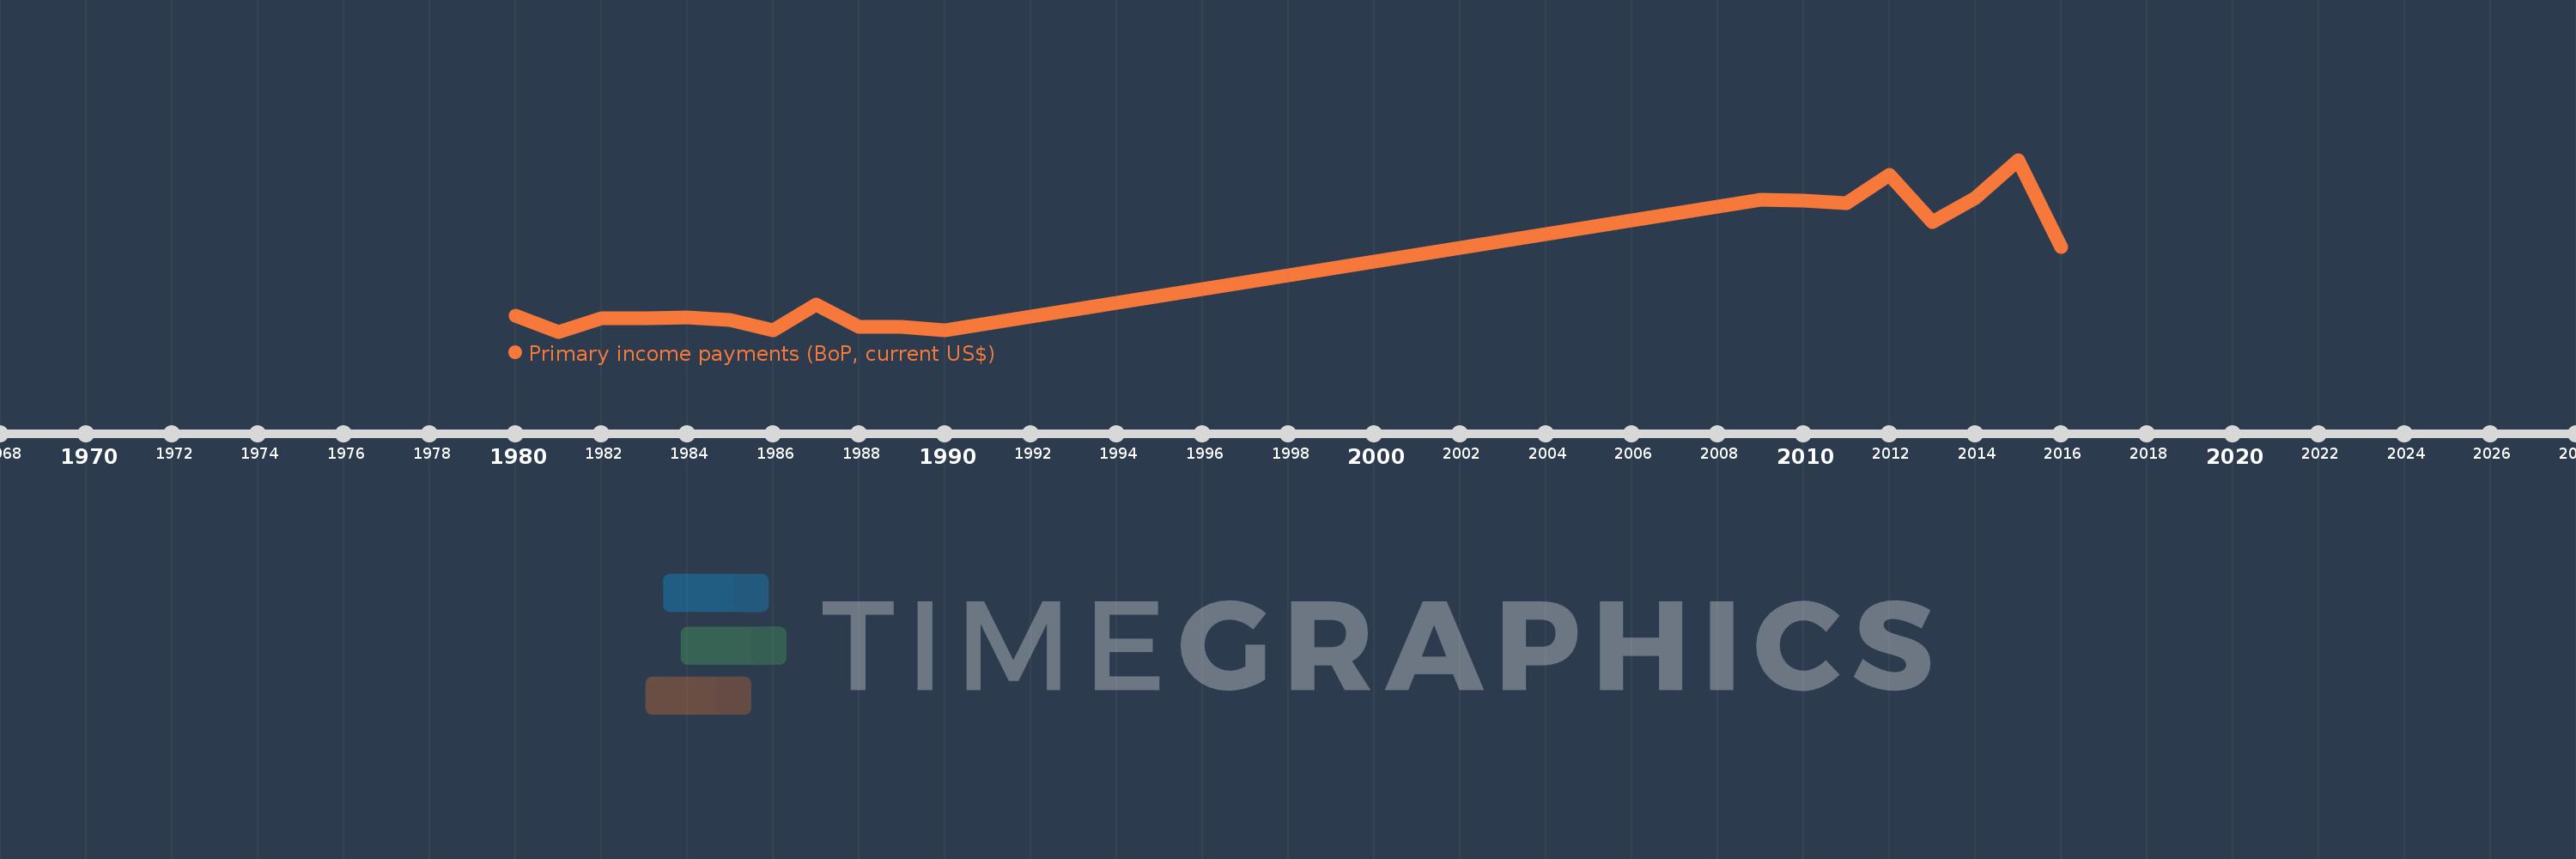
Cette échelle de temps montre un graphique de 1980 année à 2016 année Afghanistan. Les données jusqu'à 1979 année ne sont pas présentés. Quantité d'observations actuelles selon dates: 19.
Source (désignation):
Les indicateurs du développement mondiale
Source (organisation):
International Monetary Fund, Balance of Payments Statistics Yearbook and data files.
Catégories:
Economy & Growth
Dernière mise à jour
23 avr. 2017
Les indicateurs de changement de valeurs selon les années
En moyenne:
68.901 mln.
Minimum:
6.9 mln.
1 janv. 1981
Maximum:
182.149 mln.
1 janv. 2015
Pour la date d''observation
Valeur
Changement absolu
Le changement par rapport à la valeur précédente
1 janv. 1980
23.5 mln.
+23.5 mln.
0.0%
1 janv. 1981
6.9 mln.
-16.6 mln.
-70.64%
1 janv. 1982
20.1 mln.
+13.2 mln.
191.3%
1 janv. 1983
20.1 mln.
0.0
0.0%
1 janv. 1984
21.4 mln.
+1.3 mln.
6.47%
1 janv. 1985
18.5 mln.
-2.9 mln.
-13.55%
1 janv. 1986
8.6 mln.
-9.9 mln.
-53.51%
1 janv. 1987
34.6 mln.
+26.0 mln.
302.33%
1 janv. 1988
11.3 mln.
-23.3 mln.
-67.34%
1 janv. 1989
11.5 mln.
+200.0 milles
1.77%
1 janv. 1990
7.9 mln.
-3.6 mln.
-31.3%
1 janv. 2009
141.83 mln.
+133.93 mln.
1.7 milles%
1 janv. 2010
140.146 mln.
-1.684 mln.
-1.19%
1 janv. 2011
138.166 mln.
-1.98 mln.
-1.41%
1 janv. 2012
167.106 mln.
+28.94 mln.
20.95%
1 janv. 2013
118.981 mln.
-48.125 mln.
-28.8%
1 janv. 2014
142.829 mln.
+23.848 mln.
20.04%
1 janv. 2015
182.149 mln.
+39.321 mln.
27.53%
1 janv. 2016
93.506 mln.
-88.643 mln.
-48.66%
Classement des pays selon les statistiques actuelles par années

Commentaires:

Envoyer
PremiumAbout & FeedbackUn accordConfidentialité
logo
© 2022 Selected Technologies LLC – Morgan Hill, California