29
/fr/
fr
AIzaSyAYiBZKx7MnpbEhh9jyipgxe19OcubqV5w
April 1, 2024
79585
Barbados
BRB
true
2
1
Industry, value added (current LCU)
2015,2014,2013,2012,2011,2010,2009,2008,2007,2006,2005,2004,2003,2002,2001,2000,1999,1998,1997,1996,1995,1994,1993,1992,1991
Download
Bibliothèque de statistiques globales →Barbados →

Industry, value added (current LCU)

Cette statistique dans les autres pays:
AfghanistanAlbaniaAlgeriaAndorraAngolaAntigua and BarbudaArgentinaArmeniaArubaAustraliaAustriaAzerbaijanBahamas, TheBahrainBangladeshBarbadosBelarusBelgiumBelizeBeninBermudaBhutanBoliviaBosnia and HerzegovinaBotswanaBrazilBrunei DarussalamBulgariaBurkina FasoBurundiCabo VerdeCambodiaCameroonCanadaCayman IslandsCentral African RepublicChadChileChinaColombiaComorosCongo, Dem. Rep.Congo, Rep.Costa RicaCote d'IvoireCroatiaCubaCyprusCzech RepublicDenmarkDjiboutiDominicaDominican RepublicEcuadorEgypt, Arab Rep.El SalvadorEquatorial GuineaEritreaEstoniaEthiopiaFijiFinlandFranceGabonGambia, TheGeorgiaGermanyGhanaGreeceGrenadaGuatemalaGuineaGuinea-BissauGuyanaHondurasHong Kong SAR, ChinaHungaryIcelandIndiaIndonesiaIran, Islamic Rep.IraqIrelandItalyJamaicaJapanJordanKazakhstanKenyaKiribatiKorea, Rep.KosovoKuwaitKyrgyz RepublicLao PDRLatviaLebanonLesothoLiberiaLibyaLiechtensteinLithuaniaLuxembourgMacao SAR, ChinaMacedonia, FYRMadagascarMalawiMalaysiaMaldivesMaliMaltaMarshall IslandsMauritaniaMauritiusMexicoMicronesia, Fed. Sts.MoldovaMongoliaMontenegroMoroccoMozambiqueMyanmarNamibiaNepalNetherlandsNew CaledoniaNew ZealandNicaraguaNigerNigeriaNorwayOmanPakistanPalauPanamaPapua New GuineaParaguayPeruPhilippinesPolandPortugalPuerto RicoQatarRomaniaRussian FederationRwandaSamoaSao Tome and PrincipeSaudi ArabiaSenegalSerbiaSeychellesSierra LeoneSingaporeSlovak RepublicSloveniaSolomon IslandsSomaliaSouth AfricaSpainSri LankaSt. Kitts and NevisSt. LuciaSt. Vincent and the GrenadinesSudanSurinameSwazilandSwedenSwitzerlandSyrian Arab RepublicTajikistanTanzaniaThailandTimor-LesteTogoTongaTrinidad and TobagoTunisiaTurkeyTurkmenistanTuvaluUgandaUkraineUnited Arab EmiratesUnited KingdomUnited StatesUruguayUzbekistanVanuatuVenezuela, RBVietnamWest Bank and GazaYemen, Rep.ZambiaZimbabwe
La ligne de temps
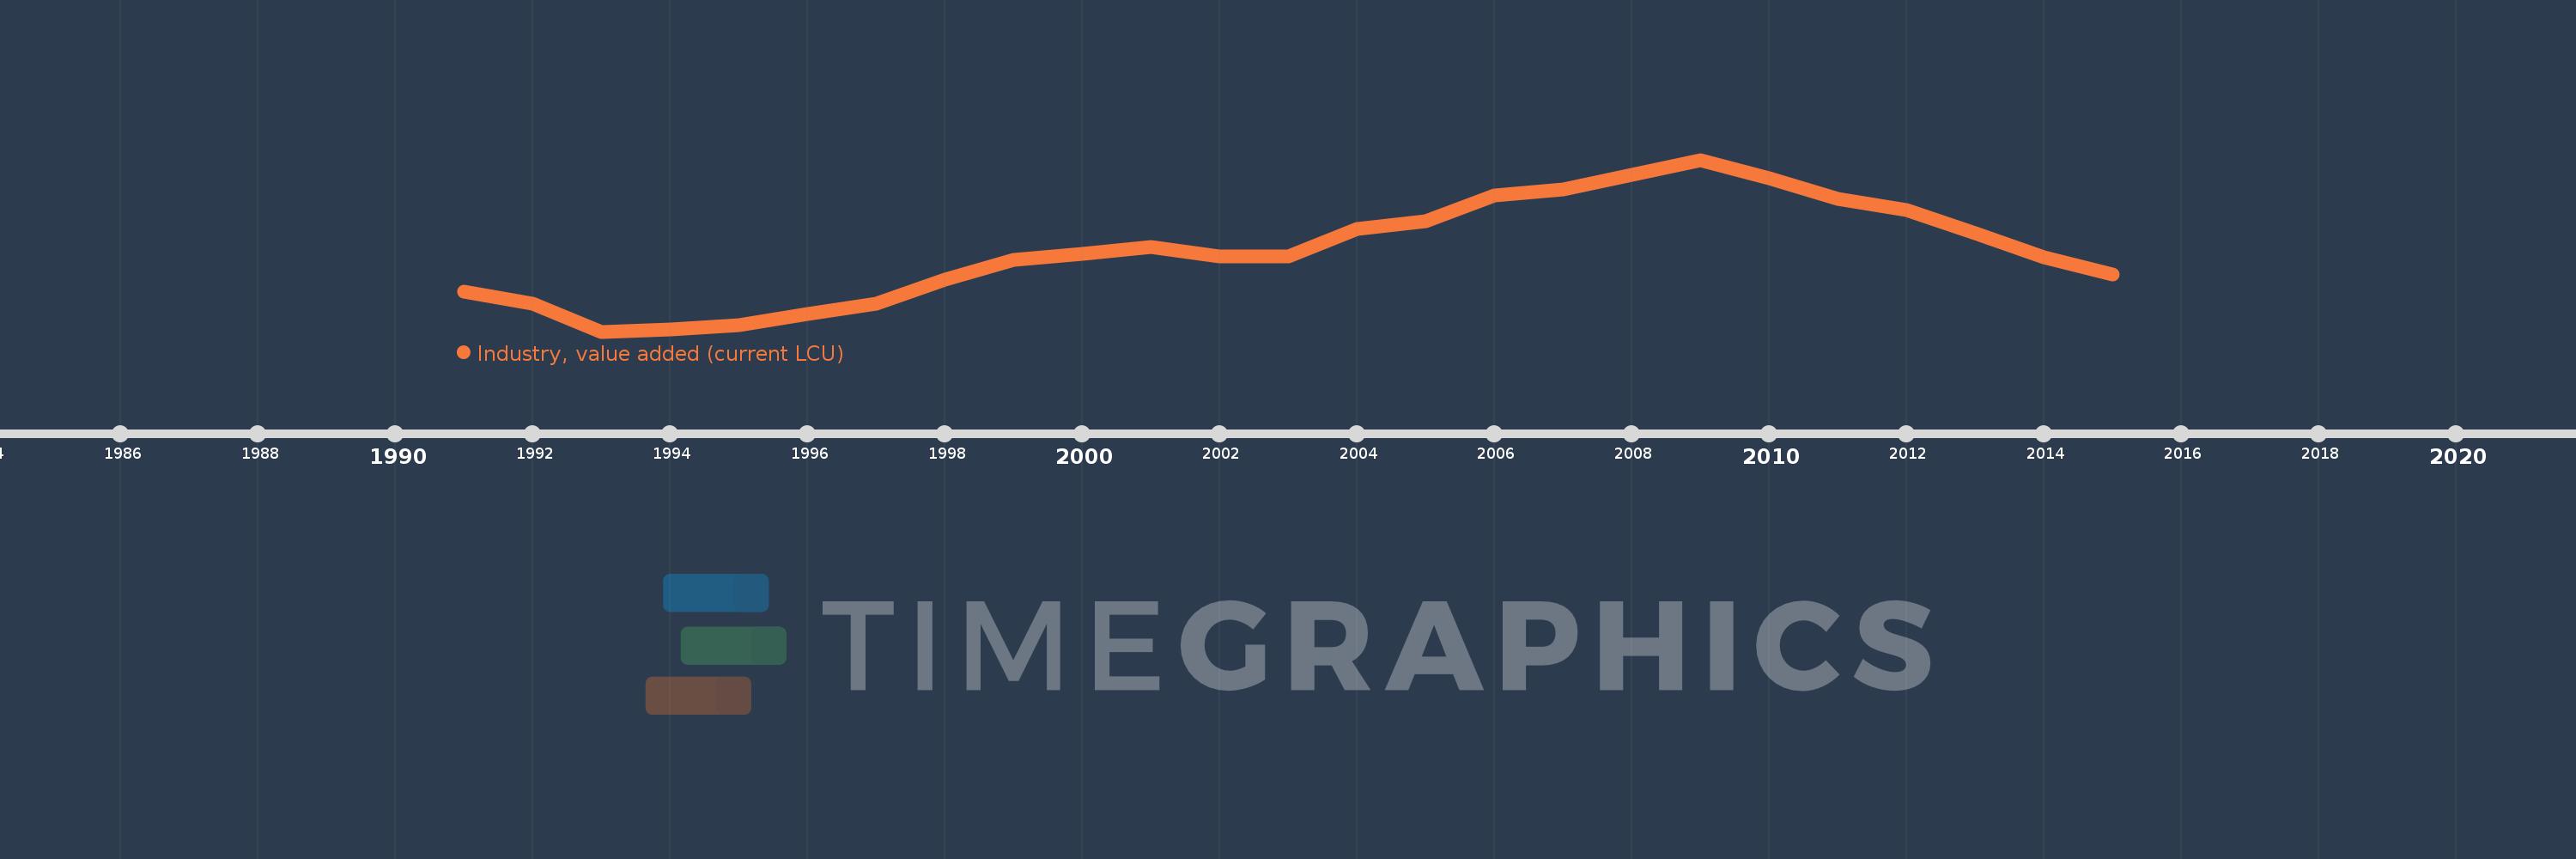
Cette échelle de temps montre un graphique de 1991 année à 2015 année Barbados. Les données jusqu'à 1990 année ne sont pas présentés. Quantité d'observations actuelles selon dates: 25.
Source (désignation):
Les indicateurs du développement mondiale
Source (organisation):
World Bank national accounts data, and OECD National Accounts data files.
Catégories:
Economy & Growth
Dernière mise à jour
23 avr. 2017
Les indicateurs de changement de valeurs selon les années
En moyenne:
919.564 mln.
Minimum:
596.9 mln.
1 janv. 1993
Maximum:
1.284 mds
1 janv. 2009
Pour la date d''observation
Valeur
Changement absolu
Le changement par rapport à la valeur précédente
1 janv. 1991
757.0 mln.
+757.0 mln.
0.0%
1 janv. 1992
706.9 mln.
-50.1 mln.
-6.62%
1 janv. 1993
596.9 mln.
-110.0 mln.
-15.56%
1 janv. 1994
606.4 mln.
+9.5 mln.
1.59%
1 janv. 1995
621.2 mln.
+14.8 mln.
2.44%
1 janv. 1996
666.4 mln.
+45.2 mln.
7.28%
1 janv. 1997
709.2 mln.
+42.8 mln.
6.42%
1 janv. 1998
806.1 mln.
+96.9 mln.
13.66%
1 janv. 1999
884.6 mln.
+78.5 mln.
9.74%
1 janv. 2000
908.0 mln.
+23.4 mln.
2.65%
1 janv. 2001
936.6 mln.
+28.6 mln.
3.15%
1 janv. 2002
897.5 mln.
-39.1 mln.
-4.17%
1 janv. 2003
895.9 mln.
-1.6 mln.
-0.18%
1 janv. 2004
1.008 mds
+112.2 mln.
12.52%
1 janv. 2005
1.039 mds
+31.3 mln.
3.1%
1 janv. 2006
1.142 mds
+102.3 mln.
9.84%
1 janv. 2007
1.167 mds
+25.4 mln.
2.22%
1 janv. 2008
1.225 mds
+57.7 mln.
4.94%
1 janv. 2009
1.284 mds
+59.2 mln.
4.83%
1 janv. 2010
1.209 mds
-74.7 mln.
-5.82%
1 janv. 2011
1.127 mds
-81.8 mln.
-6.76%
1 janv. 2012
1.084 mds
-43.1 mln.
-3.82%
1 janv. 2013
990.3 mln.
-94.1 mln.
-8.68%
1 janv. 2014
893.8 mln.
-96.5 mln.
-9.74%
1 janv. 2015
826.0 mln.
-67.8 mln.
-7.59%
Classement des pays selon les statistiques actuelles par années

Commentaires:

Envoyer
PremiumAbout & FeedbackUn accordConfidentialité
logo
© 2022 Selected Technologies LLC – Morgan Hill, California