33
/fr/
AIzaSyAYiBZKx7MnpbEhh9jyipgxe19OcubqV5w
August 1, 2025
77246
Bahrain
BHR
true
2
1
Industry, value added (current LCU)
2016,2015,2014,2013,2012,2011,1996,1995,1994,1993,1992,1991,1990,1989,1988,1987,1986,1985,1984,1983,1982,1981
Download
Bibliothèque de statistiques globales →Bahrain →

Industry, value added (current LCU)

Cette statistique dans les autres pays:

AfghanistanAlbaniaAlgeriaAndorraAngolaAntigua and BarbudaArgentinaArmeniaArubaAustraliaAustriaAzerbaijanBahamas, TheBahrainBangladeshBarbadosBelarusBelgiumBelizeBeninBermudaBhutanBoliviaBosnia and HerzegovinaBotswanaBrazilBrunei DarussalamBulgariaBurkina FasoBurundiCabo VerdeCambodiaCameroonCanadaCayman IslandsCentral African RepublicChadChileChinaColombiaComorosCongo, Dem. Rep.Congo, Rep.Costa RicaCote d'IvoireCroatiaCubaCyprusCzech RepublicDenmarkDjiboutiDominicaDominican RepublicEcuadorEgypt, Arab Rep.El SalvadorEquatorial GuineaEritreaEstoniaEthiopiaFijiFinlandFranceGabonGambia, TheGeorgiaGermanyGhanaGreeceGrenadaGuatemalaGuineaGuinea-BissauGuyanaHondurasHong Kong SAR, ChinaHungaryIcelandIndiaIndonesiaIran, Islamic Rep.IraqIrelandItalyJamaicaJapanJordanKazakhstanKenyaKiribatiKorea, Rep.KosovoKuwaitKyrgyz RepublicLao PDRLatviaLebanonLesothoLiberiaLibyaLiechtensteinLithuaniaLuxembourgMacao SAR, ChinaMacedonia, FYRMadagascarMalawiMalaysiaMaldivesMaliMaltaMarshall IslandsMauritaniaMauritiusMexicoMicronesia, Fed. Sts.MoldovaMongoliaMontenegroMoroccoMozambiqueMyanmarNamibiaNepalNetherlandsNew CaledoniaNew ZealandNicaraguaNigerNigeriaNorwayOmanPakistanPalauPanamaPapua New GuineaParaguayPeruPhilippinesPolandPortugalPuerto RicoQatarRomaniaRussian FederationRwandaSamoaSao Tome and PrincipeSaudi ArabiaSenegalSerbiaSeychellesSierra LeoneSingaporeSlovak RepublicSloveniaSolomon IslandsSomaliaSouth AfricaSpainSri LankaSt. Kitts and NevisSt. LuciaSt. Vincent and the GrenadinesSudanSurinameSwazilandSwedenSwitzerlandSyrian Arab RepublicTajikistanTanzaniaThailandTimor-LesteTogoTongaTrinidad and TobagoTunisiaTurkeyTurkmenistanTuvaluUgandaUkraineUnited Arab EmiratesUnited KingdomUnited StatesUruguayUzbekistanVanuatuVenezuela, RBVietnamWest Bank and GazaYemen, Rep.ZambiaZimbabwe

La ligne de temps

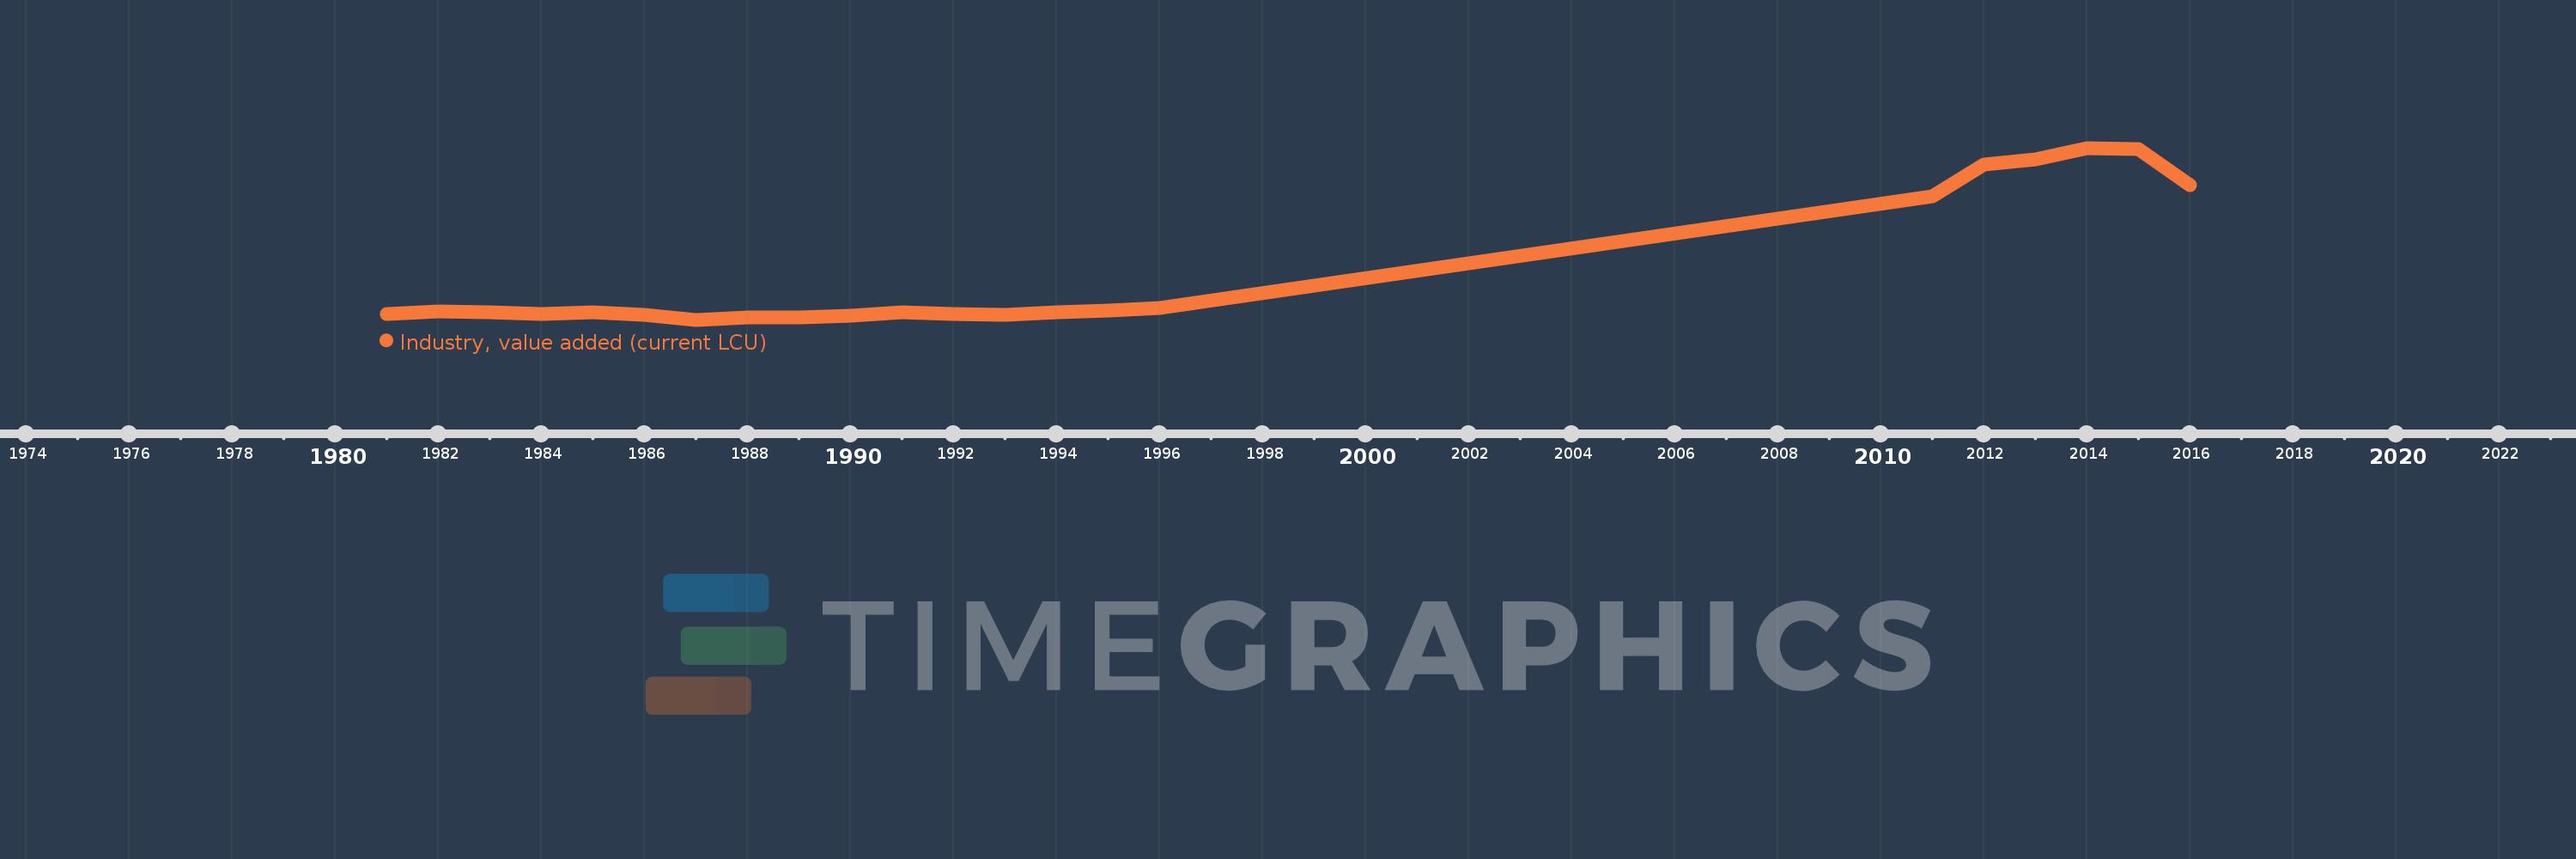
Cette échelle de temps montre un graphique de 1981 année à 2016 année Bahrain. Les données jusqu'à 1980 année ne sont pas présentés. Quantité d'observations actuelles selon dates: 22.

Source (désignation):

Les indicateurs du développement mondiale

Source (organisation):

World Bank national accounts data, and OECD National Accounts data files.

Catégories:

Economy & Growth

Dernière mise à jour

23 avr. 2017

Les indicateurs de changement de valeurs selon les années

En moyenne:
1.936 mds
Minimum:
499.521 mln.
1 janv. 1987
Maximum:
5.866 mds
1 janv. 2014
Pour la date d''observation
Valeur
Changement absolu
Le changement par rapport à la valeur précédente
1 janv. 1981
684.3 mln.
+684.3 mln.
0.0%
1 janv. 1982
753.7 mln.
+69.4 mln.
10.14%
1 janv. 1983
724.9 mln.
-28.8 mln.
-3.82%
1 janv. 1984
676.8 mln.
-48.1 mln.
-6.64%
1 janv. 1985
719.7 mln.
+42.9 mln.
6.34%
1 janv. 1986
665.3 mln.
-54.4 mln.
-7.56%
1 janv. 1987
499.521 mln.
-165.78 mln.
-24.92%
1 janv. 1988
561.505 mln.
+61.985 mln.
12.41%
1 janv. 1989
584.938 mln.
+23.432 mln.
4.17%
1 janv. 1990
617.233 mln.
+32.295 mln.
5.52%
1 janv. 1991
727.363 mln.
+110.13 mln.
17.84%
1 janv. 1992
691.926 mln.
-35.437 mln.
-4.87%
1 janv. 1993
664.746 mln.
-27.18 mln.
-3.93%
1 janv. 1994
741.938 mln.
+77.192 mln.
11.61%
1 janv. 1995
783.454 mln.
+41.516 mln.
5.6%
1 janv. 1996
878.608 mln.
+95.154 mln.
12.15%
1 janv. 2011
4.348 mds
+3.47 mds
394.91%
1 janv. 2012
5.358 mds
+1.009 mds
23.21%
1 janv. 2013
5.497 mds
+139.74 mln.
2.61%
1 janv. 2014
5.866 mds
+368.53 mln.
6.7%
1 janv. 2015
5.84 mds
-26.04 mln.
-0.44%
1 janv. 2016
4.716 mds
-1.124 mds
-19.24%

Classement des pays selon les statistiques actuelles par années