33
/fr/
AIzaSyAYiBZKx7MnpbEhh9jyipgxe19OcubqV5w
August 1, 2025
243726
Solomon Islands
SLB
true
2
1
Industry, value added (current LCU)
2007,2006,2005,2004,2003,2002,2001,2000,1999,1998,1997,1996,1995,1994,1993,1992,1991
Download
Bibliothèque de statistiques globales →Solomon Islands →

Industry, value added (current LCU)

Cette statistique dans les autres pays:

AfghanistanAlbaniaAlgeriaAndorraAngolaAntigua and BarbudaArgentinaArmeniaArubaAustraliaAustriaAzerbaijanBahamas, TheBahrainBangladeshBarbadosBelarusBelgiumBelizeBeninBermudaBhutanBoliviaBosnia and HerzegovinaBotswanaBrazilBrunei DarussalamBulgariaBurkina FasoBurundiCabo VerdeCambodiaCameroonCanadaCayman IslandsCentral African RepublicChadChileChinaColombiaComorosCongo, Dem. Rep.Congo, Rep.Costa RicaCote d'IvoireCroatiaCubaCyprusCzech RepublicDenmarkDjiboutiDominicaDominican RepublicEcuadorEgypt, Arab Rep.El SalvadorEquatorial GuineaEritreaEstoniaEthiopiaFijiFinlandFranceGabonGambia, TheGeorgiaGermanyGhanaGreeceGrenadaGuatemalaGuineaGuinea-BissauGuyanaHondurasHong Kong SAR, ChinaHungaryIcelandIndiaIndonesiaIran, Islamic Rep.IraqIrelandItalyJamaicaJapanJordanKazakhstanKenyaKiribatiKorea, Rep.KosovoKuwaitKyrgyz RepublicLao PDRLatviaLebanonLesothoLiberiaLibyaLiechtensteinLithuaniaLuxembourgMacao SAR, ChinaMacedonia, FYRMadagascarMalawiMalaysiaMaldivesMaliMaltaMarshall IslandsMauritaniaMauritiusMexicoMicronesia, Fed. Sts.MoldovaMongoliaMontenegroMoroccoMozambiqueMyanmarNamibiaNepalNetherlandsNew CaledoniaNew ZealandNicaraguaNigerNigeriaNorwayOmanPakistanPalauPanamaPapua New GuineaParaguayPeruPhilippinesPolandPortugalPuerto RicoQatarRomaniaRussian FederationRwandaSamoaSao Tome and PrincipeSaudi ArabiaSenegalSerbiaSeychellesSierra LeoneSingaporeSlovak RepublicSloveniaSolomon IslandsSomaliaSouth AfricaSpainSri LankaSt. Kitts and NevisSt. LuciaSt. Vincent and the GrenadinesSudanSurinameSwazilandSwedenSwitzerlandSyrian Arab RepublicTajikistanTanzaniaThailandTimor-LesteTogoTongaTrinidad and TobagoTunisiaTurkeyTurkmenistanTuvaluUgandaUkraineUnited Arab EmiratesUnited KingdomUnited StatesUruguayUzbekistanVanuatuVenezuela, RBVietnamWest Bank and GazaYemen, Rep.ZambiaZimbabwe

La ligne de temps

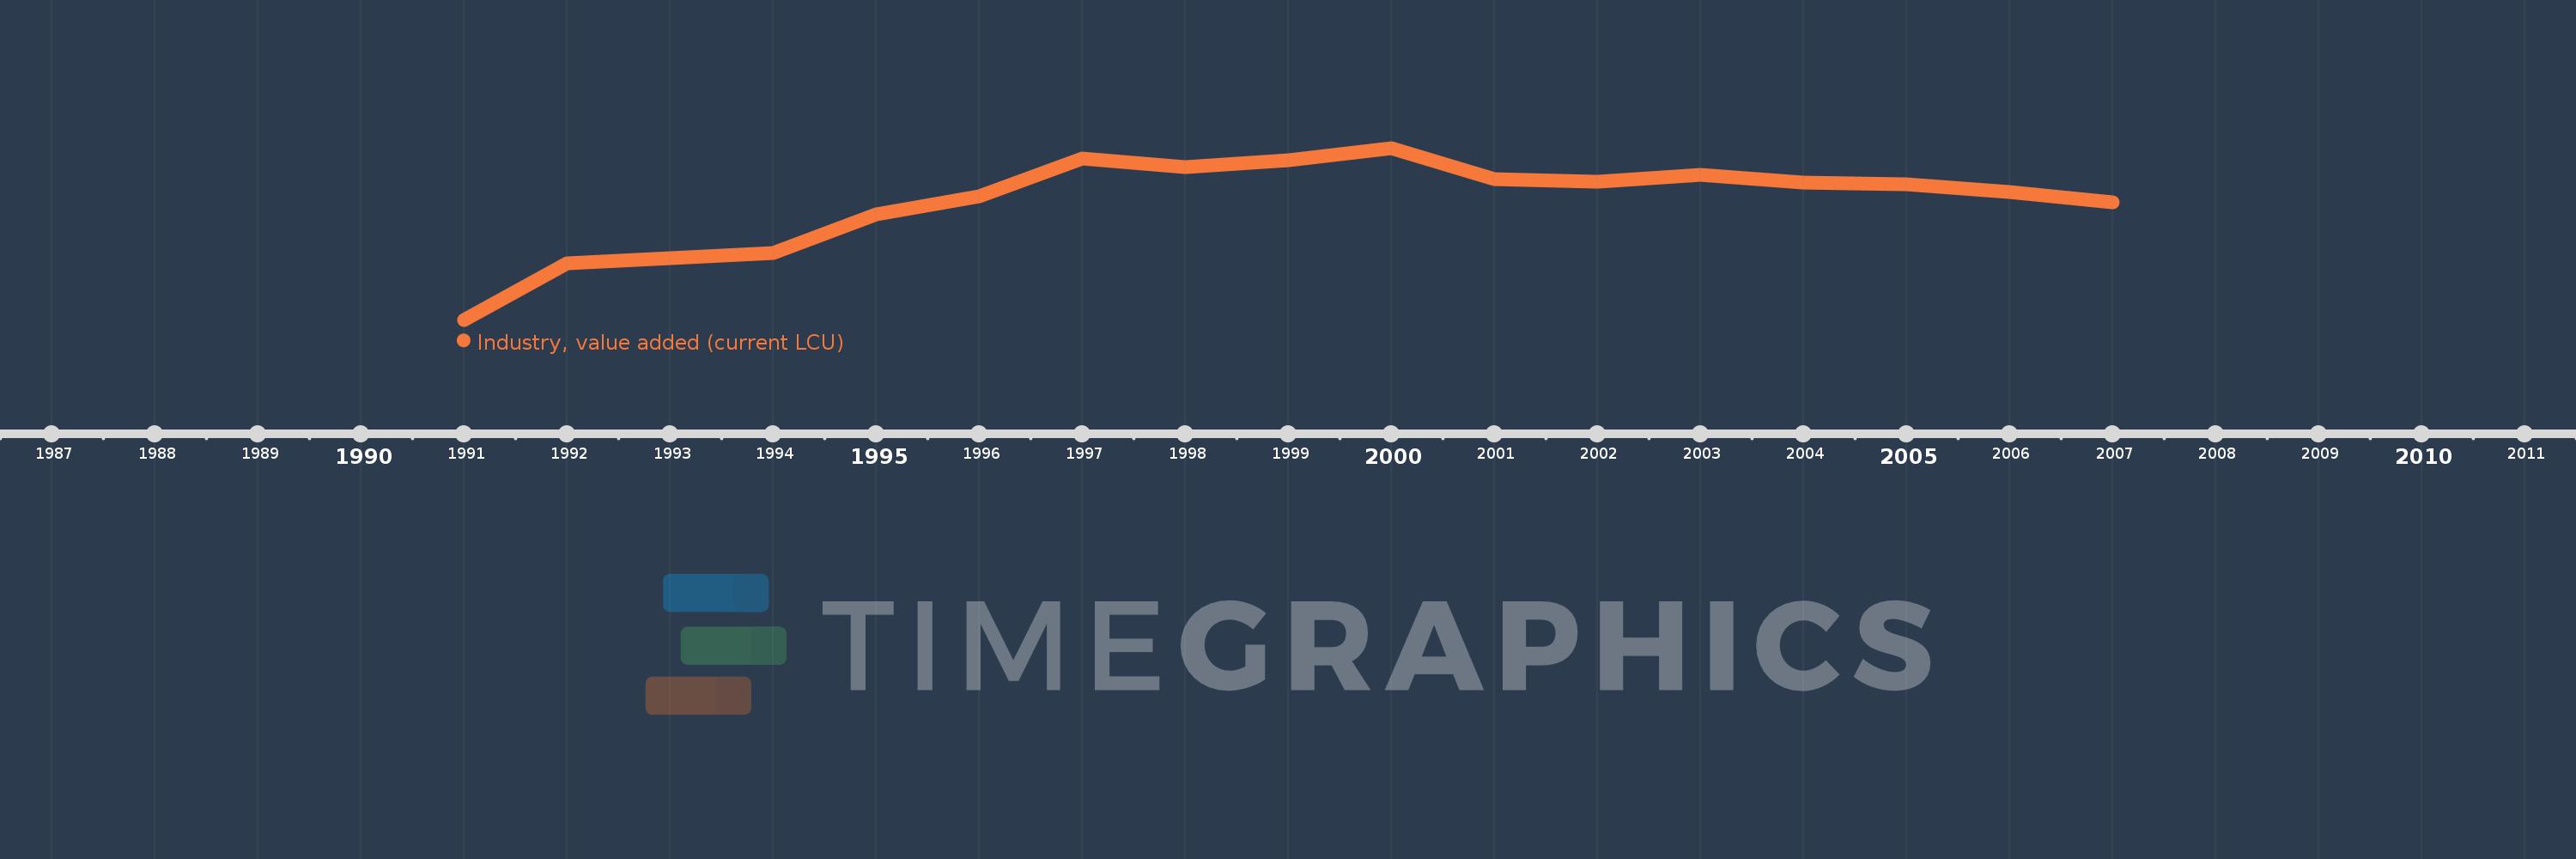
Cette échelle de temps montre un graphique de 1991 année à 2007 année Solomon Islands. Les données jusqu'à 1990 année ne sont pas présentés. Quantité d'observations actuelles selon dates: 17.

Source (désignation):

Les indicateurs du développement mondiale

Source (organisation):

World Bank national accounts data, and OECD National Accounts data files.

Catégories:

Economy & Growth

Dernière mise à jour

23 avr. 2017

Les indicateurs de changement de valeurs selon les années

En moyenne:
230.975 mln.
Minimum:
36.1 mln.
1 janv. 1991
Maximum:
320.6 mln.
1 janv. 2000
Pour la date d''observation
Valeur
Changement absolu
Le changement par rapport à la valeur précédente
1 janv. 1991
36.1 mln.
+36.1 mln.
0.0%
1 janv. 1992
129.5 mln.
+93.4 mln.
258.73%
1 janv. 1993
138.8 mln.
+9.3 mln.
7.18%
1 janv. 1994
146.9 mln.
+8.1 mln.
5.84%
1 janv. 1995
210.4 mln.
+63.5 mln.
43.23%
1 janv. 1996
240.7 mln.
+30.3 mln.
14.4%
1 janv. 1997
302.4 mln.
+61.7 mln.
25.63%
1 janv. 1998
288.9 mln.
-13.5 mln.
-4.46%
1 janv. 1999
300.8 mln.
+11.9 mln.
4.12%
1 janv. 2000
320.6 mln.
+19.8 mln.
6.58%
1 janv. 2001
269.6 mln.
-51.0 mln.
-15.91%
1 janv. 2002
264.454 mln.
-5.146 mln.
-1.91%
1 janv. 2003
276.029 mln.
+11.575 mln.
4.38%
1 janv. 2004
263.3 mln.
-12.729 mln.
-4.61%
1 janv. 2005
259.8 mln.
-3.5 mln.
-1.33%
1 janv. 2006
247.7 mln.
-12.1 mln.
-4.66%
1 janv. 2007
230.6 mln.
-17.1 mln.
-6.9%

Classement des pays selon les statistiques actuelles par années