33
/fr/
AIzaSyAYiBZKx7MnpbEhh9jyipgxe19OcubqV5w
August 1, 2025
75418
Azerbaijan
AZE
true
2
1
Net secondary income (BoP, current US$)
2016,2015,2014,2013,2012,2011,2010,2009,2008,2007,2006,2005,2004,2003,2002,2001,2000,1999,1998,1997,1996
Download
Bibliothèque de statistiques globales →Azerbaijan →

Net secondary income (BoP, current US$)

Cette statistique dans les autres pays:

AfghanistanAlbaniaAlgeriaAngolaAntigua and BarbudaArgentinaArmeniaArubaAustraliaAustriaAzerbaijanBahamas, TheBahrainBangladeshBarbadosBelarusBelgiumBelizeBeninBermudaBhutanBoliviaBosnia and HerzegovinaBotswanaBrazilBrunei DarussalamBulgariaBurkina FasoBurundiCabo VerdeCambodiaCameroonCanadaCentral African RepublicChadChileChinaColombiaComorosCongo, Dem. Rep.Congo, Rep.Costa RicaCote d'IvoireCroatiaCuracaoCyprusCzech RepublicDenmarkDjiboutiDominicaDominican RepublicEcuadorEgypt, Arab Rep.El SalvadorEquatorial GuineaEritreaEstoniaEthiopiaEuro areaFaroe IslandsFijiFinlandFranceFrench PolynesiaGabonGambia, TheGeorgiaGermanyGhanaGreeceGrenadaGuatemalaGuineaGuinea-BissauGuyanaHaitiHondurasHong Kong SAR, ChinaHungaryIcelandIndiaIndonesiaIran, Islamic Rep.IraqIrelandIsraelItalyJamaicaJapanJordanKazakhstanKenyaKiribatiKorea, Rep.KosovoKuwaitKyrgyz RepublicLao PDRLatviaLebanonLesothoLiberiaLibyaLithuaniaLuxembourgMacao SAR, ChinaMacedonia, FYRMadagascarMalawiMalaysiaMaldivesMaliMaltaMarshall IslandsMauritaniaMauritiusMexicoMicronesia, Fed. Sts.MoldovaMongoliaMontenegroMoroccoMozambiqueMyanmarNamibiaNepalNetherlandsNew CaledoniaNew ZealandNicaraguaNigerNigeriaNorwayOmanPakistanPalauPanamaPapua New GuineaParaguayPeruPhilippinesPolandPortugalQatarRomaniaRussian FederationRwandaSamoaSao Tome and PrincipeSaudi ArabiaSenegalSerbiaSeychellesSierra LeoneSingaporeSint Maarten (Dutch part)Slovak RepublicSloveniaSolomon IslandsSouth AfricaSouth SudanSpainSri LankaSt. Kitts and NevisSt. LuciaSt. Vincent and the GrenadinesSudanSurinameSwazilandSwedenSwitzerlandSyrian Arab RepublicTajikistanTanzaniaThailandTimor-LesteTogoTongaTrinidad and TobagoTunisiaTurkeyTuvaluUgandaUkraineUnited KingdomUnited StatesUruguayVanuatuVenezuela, RBVietnamWest Bank and GazaYemen, Rep.ZambiaZimbabwe

La ligne de temps

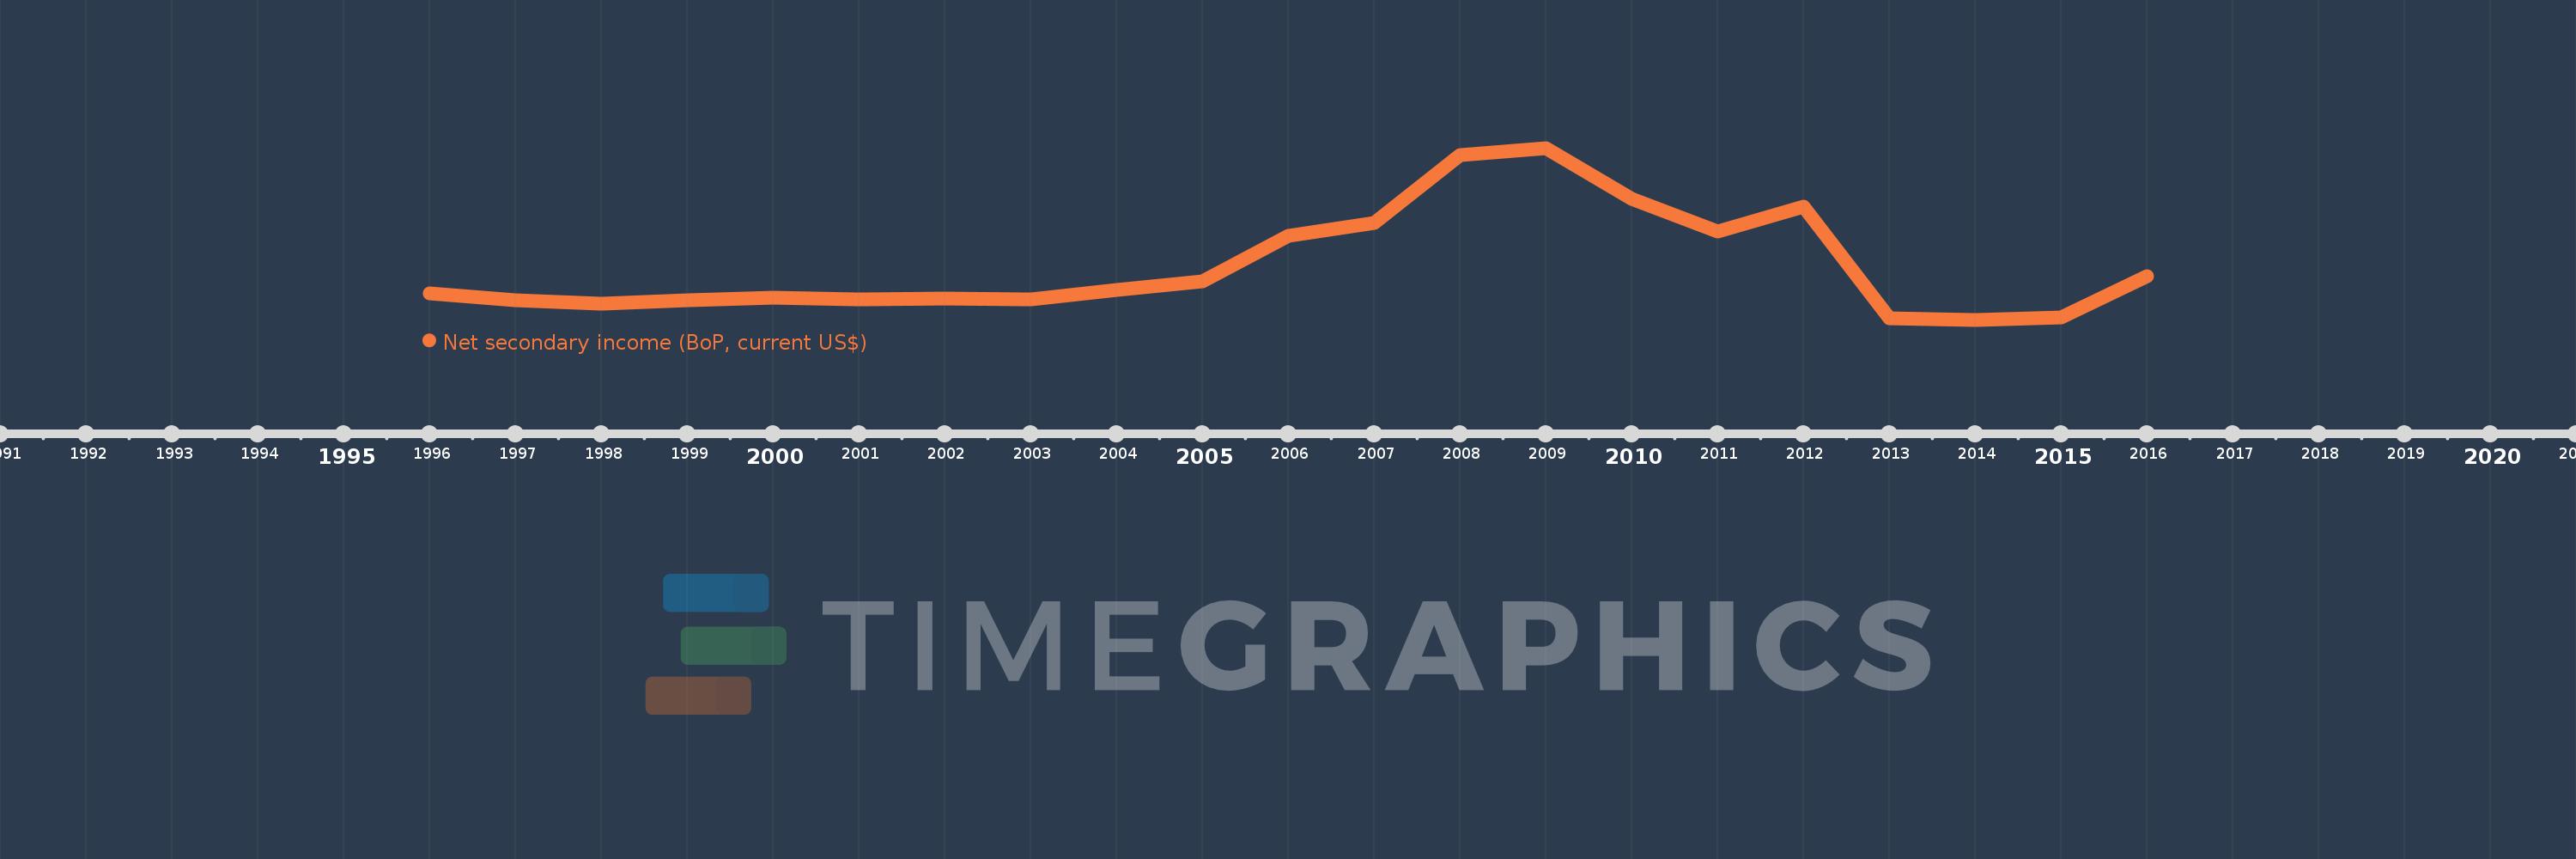
Cette échelle de temps montre un graphique de 1996 année à 2016 année Azerbaijan. Les données jusqu'à 1995 année ne sont pas présentés. Quantité d'observations actuelles selon dates: 21.

Source (désignation):

Les indicateurs du développement mondiale

Source (organisation):

International Monetary Fund, Balance of Payments Statistics Yearbook and data files.

Catégories:

Economy & Growth

Dernière mise à jour

23 avr. 2017

Les indicateurs de changement de valeurs selon les années

En moyenne:
284.974 mln.
Minimum:
-59.961 mln.
1 janv. 2014
Maximum:
1.05 mds
1 janv. 2009
Pour la date d''observation
Valeur
Changement absolu
Le changement par rapport à la valeur précédente
1 janv. 1996
110.754 mln.
+110.754 mln.
0.0%
1 janv. 1997
66.494 mln.
-44.26 mln.
-39.96%
1 janv. 1998
44.795 mln.
-21.699 mln.
-32.63%
1 janv. 1999
64.006 mln.
+19.211 mln.
42.89%
1 janv. 2000
81.753 mln.
+17.747 mln.
27.73%
1 janv. 2001
73.091 mln.
-8.662 mln.
-10.6%
1 janv. 2002
76.597 mln.
+3.506 mln.
4.8%
1 janv. 2003
70.357 mln.
-6.24 mln.
-8.15%
1 janv. 2004
134.134 mln.
+63.777 mln.
90.65%
1 janv. 2005
188.497 mln.
+54.363 mln.
40.53%
1 janv. 2006
483.871 mln.
+295.374 mln.
156.7%
1 janv. 2007
566.266 mln.
+82.395 mln.
17.03%
1 janv. 2008
1.005 mds
+438.761 mln.
77.48%
1 janv. 2009
1.05 mds
+45.423 mln.
4.52%
1 janv. 2010
721.692 mln.
-328.758 mln.
-31.3%
1 janv. 2011
509.131 mln.
-212.561 mln.
-29.45%
1 janv. 2012
673.343 mln.
+164.212 mln.
32.25%
1 janv. 2013
-49.995 mln.
-723.338 mln.
-107.42%
1 janv. 2014
-59.961 mln.
-9.966 mln.
19.93%
1 janv. 2015
-47.593 mln.
+12.368 mln.
-20.63%
1 janv. 2016
221.745 mln.
+269.338 mln.
-565.92%

Classement des pays selon les statistiques actuelles par années