33
/fr/
AIzaSyAYiBZKx7MnpbEhh9jyipgxe19OcubqV5w
August 1, 2025
175679
Latvia
LVA
true
2
1
Net secondary income (BoP, current US$)
2016,2015,2014,2013,2012,2011,2010,2009,2008,2007,2006,2005,2004,2003,2002,2001,2000,1999,1998,1997,1996,1995,1994,1993
Download
Bibliothèque de statistiques globales →Latvia →

Net secondary income (BoP, current US$)

Cette statistique dans les autres pays:

AfghanistanAlbaniaAlgeriaAngolaAntigua and BarbudaArgentinaArmeniaArubaAustraliaAustriaAzerbaijanBahamas, TheBahrainBangladeshBarbadosBelarusBelgiumBelizeBeninBermudaBhutanBoliviaBosnia and HerzegovinaBotswanaBrazilBrunei DarussalamBulgariaBurkina FasoBurundiCabo VerdeCambodiaCameroonCanadaCentral African RepublicChadChileChinaColombiaComorosCongo, Dem. Rep.Congo, Rep.Costa RicaCote d'IvoireCroatiaCuracaoCyprusCzech RepublicDenmarkDjiboutiDominicaDominican RepublicEcuadorEgypt, Arab Rep.El SalvadorEquatorial GuineaEritreaEstoniaEthiopiaEuro areaFaroe IslandsFijiFinlandFranceFrench PolynesiaGabonGambia, TheGeorgiaGermanyGhanaGreeceGrenadaGuatemalaGuineaGuinea-BissauGuyanaHaitiHondurasHong Kong SAR, ChinaHungaryIcelandIndiaIndonesiaIran, Islamic Rep.IraqIrelandIsraelItalyJamaicaJapanJordanKazakhstanKenyaKiribatiKorea, Rep.KosovoKuwaitKyrgyz RepublicLao PDRLatviaLebanonLesothoLiberiaLibyaLithuaniaLuxembourgMacao SAR, ChinaMacedonia, FYRMadagascarMalawiMalaysiaMaldivesMaliMaltaMarshall IslandsMauritaniaMauritiusMexicoMicronesia, Fed. Sts.MoldovaMongoliaMontenegroMoroccoMozambiqueMyanmarNamibiaNepalNetherlandsNew CaledoniaNew ZealandNicaraguaNigerNigeriaNorwayOmanPakistanPalauPanamaPapua New GuineaParaguayPeruPhilippinesPolandPortugalQatarRomaniaRussian FederationRwandaSamoaSao Tome and PrincipeSaudi ArabiaSenegalSerbiaSeychellesSierra LeoneSingaporeSint Maarten (Dutch part)Slovak RepublicSloveniaSolomon IslandsSouth AfricaSouth SudanSpainSri LankaSt. Kitts and NevisSt. LuciaSt. Vincent and the GrenadinesSudanSurinameSwazilandSwedenSwitzerlandSyrian Arab RepublicTajikistanTanzaniaThailandTimor-LesteTogoTongaTrinidad and TobagoTunisiaTurkeyTuvaluUgandaUkraineUnited KingdomUnited StatesUruguayVanuatuVenezuela, RBVietnamWest Bank and GazaYemen, Rep.ZambiaZimbabwe

La ligne de temps

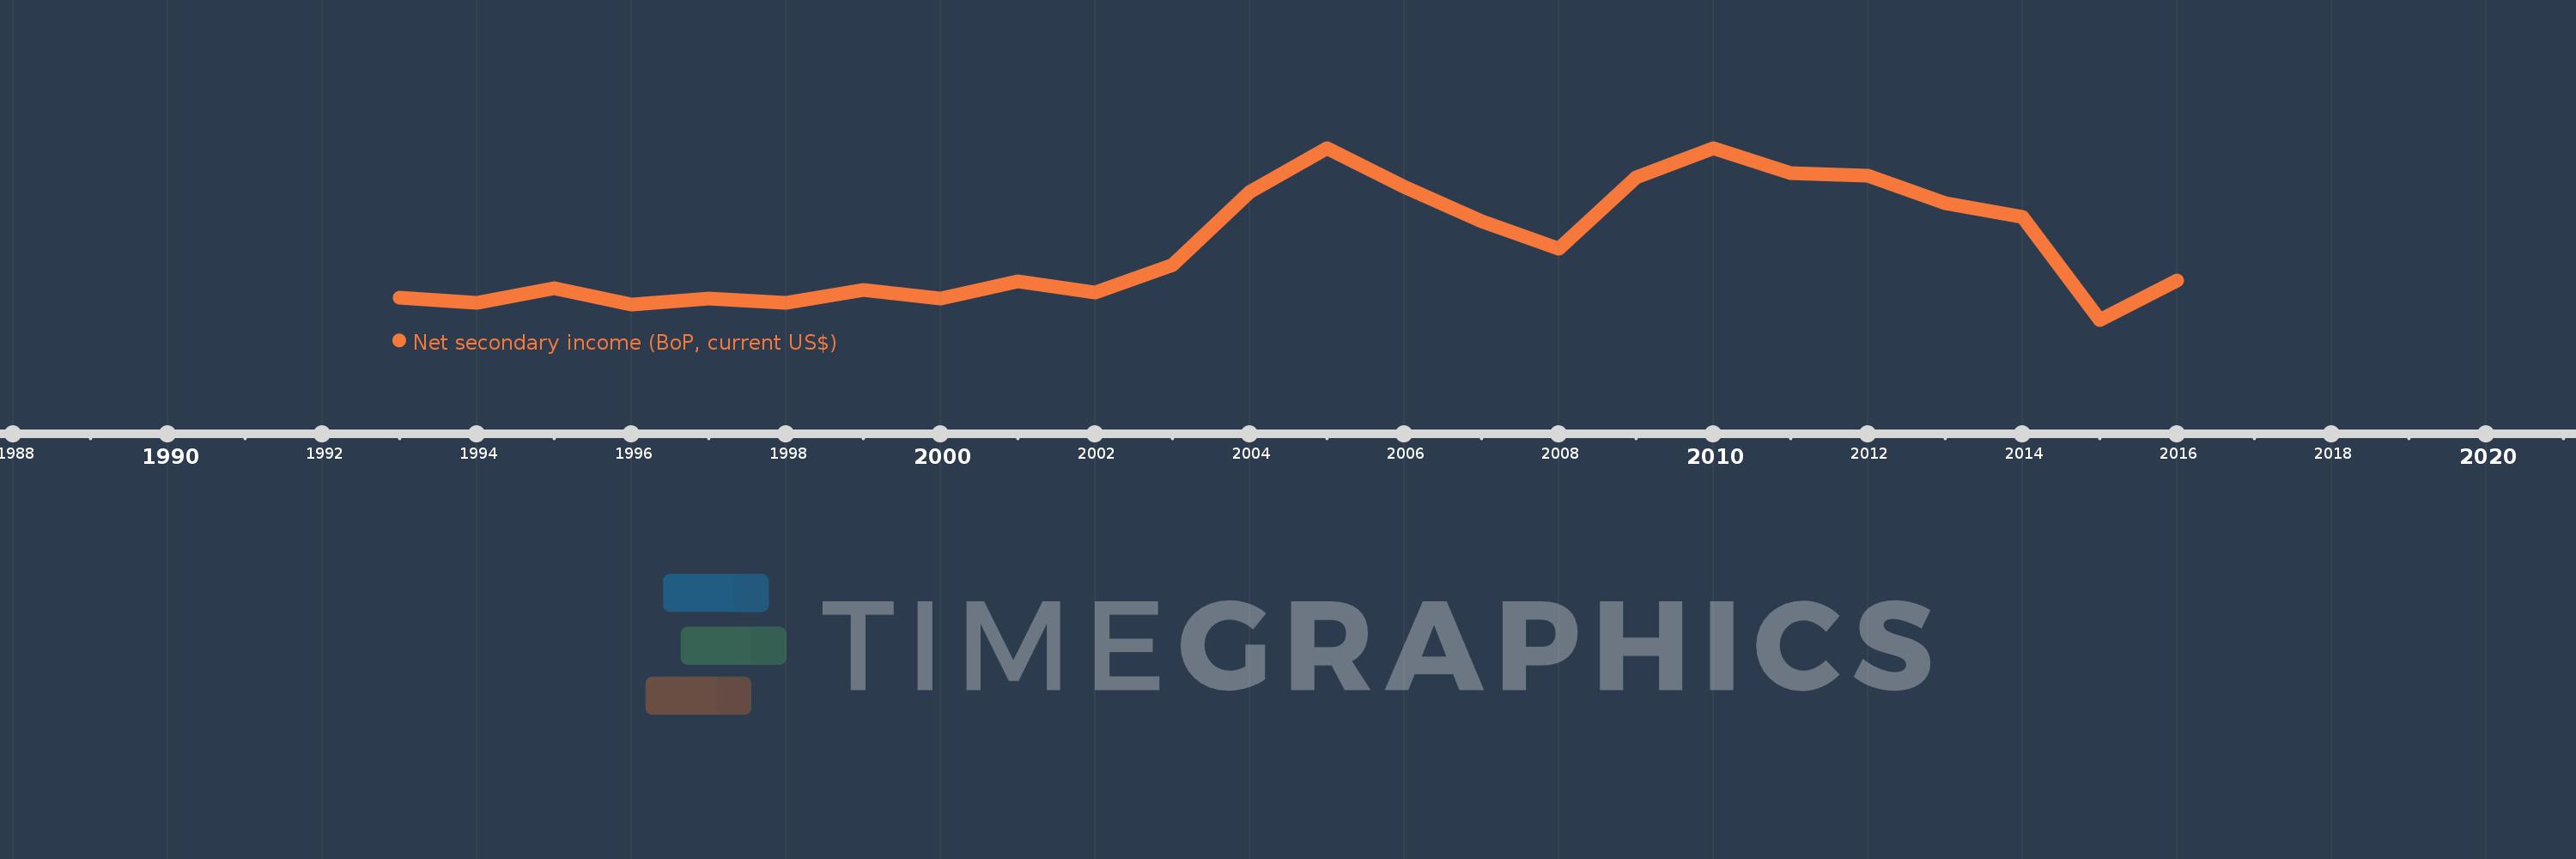
Cette échelle de temps montre un graphique de 1993 année à 2016 année Latvia. Les données jusqu'à 1992 année ne sont pas présentés. Quantité d'observations actuelles selon dates: 24.

Source (désignation):

Les indicateurs du développement mondiale

Source (organisation):

International Monetary Fund, Balance of Payments Statistics Yearbook and data files.

Catégories:

Economy & Growth

Dernière mise à jour

23 avr. 2017

Les indicateurs de changement de valeurs selon les années

En moyenne:
286.371 mln.
Minimum:
14.942 mln.
1 janv. 2015
Maximum:
650.513 mln.
1 janv. 2005
Pour la date d''observation
Valeur
Changement absolu
Le changement par rapport à la valeur précédente
1 janv. 1993
96.116 mln.
+96.116 mln.
0.0%
1 janv. 1994
77.885 mln.
-18.231 mln.
-18.97%
1 janv. 1995
132.768 mln.
+54.883 mln.
70.47%
1 janv. 1996
70.794 mln.
-61.974 mln.
-46.68%
1 janv. 1997
93.49 mln.
+22.696 mln.
32.06%
1 janv. 1998
77.377 mln.
-16.113 mln.
-17.23%
1 janv. 1999
124.5 mln.
+47.123 mln.
60.9%
1 janv. 2000
92.8 mln.
-31.7 mln.
-25.46%
1 janv. 2001
156.088 mln.
+63.288 mln.
68.2%
1 janv. 2002
115.004 mln.
-41.084 mln.
-26.32%
1 janv. 2003
218.754 mln.
+103.75 mln.
90.21%
1 janv. 2004
487.775 mln.
+269.021 mln.
122.98%
1 janv. 2005
650.513 mln.
+162.739 mln.
33.36%
1 janv. 2006
505.594 mln.
-144.92 mln.
-22.28%
1 janv. 2007
380.77 mln.
-124.823 mln.
-24.69%
1 janv. 2008
278.48 mln.
-102.291 mln.
-26.86%
1 janv. 2009
541.972 mln.
+263.492 mln.
94.62%
1 janv. 2010
648.705 mln.
+106.733 mln.
19.69%
1 janv. 2011
557.813 mln.
-90.892 mln.
-14.01%
1 janv. 2012
547.795 mln.
-10.018 mln.
-1.8%
1 janv. 2013
446.484 mln.
-101.311 mln.
-18.49%
1 janv. 2014
396.733 mln.
-49.751 mln.
-11.14%
1 janv. 2015
14.942 mln.
-381.792 mln.
-96.23%
1 janv. 2016
159.764 mln.
+144.823 mln.
969.26%

Classement des pays selon les statistiques actuelles par années