29
/fr/
fr
AIzaSyAYiBZKx7MnpbEhh9jyipgxe19OcubqV5w
April 1, 2024
102808
Central African Republic
CAF
true
2
1
Net secondary income (BoP, current US$)
1995,1994,1993,1992,1991,1990,1989,1988,1987,1986,1985,1984,1983,1982,1981,1980,1979,1978
Download
Bibliothèque de statistiques globales →Central African Republic →

Net secondary income (BoP, current US$)

Cette statistique dans les autres pays:
AfghanistanAlbaniaAlgeriaAngolaAntigua and BarbudaArgentinaArmeniaArubaAustraliaAustriaAzerbaijanBahamas, TheBahrainBangladeshBarbadosBelarusBelgiumBelizeBeninBermudaBhutanBoliviaBosnia and HerzegovinaBotswanaBrazilBrunei DarussalamBulgariaBurkina FasoBurundiCabo VerdeCambodiaCameroonCanadaCentral African RepublicChadChileChinaColombiaComorosCongo, Dem. Rep.Congo, Rep.Costa RicaCote d'IvoireCroatiaCuracaoCyprusCzech RepublicDenmarkDjiboutiDominicaDominican RepublicEcuadorEgypt, Arab Rep.El SalvadorEquatorial GuineaEritreaEstoniaEthiopiaEuro areaFaroe IslandsFijiFinlandFranceFrench PolynesiaGabonGambia, TheGeorgiaGermanyGhanaGreeceGrenadaGuatemalaGuineaGuinea-BissauGuyanaHaitiHondurasHong Kong SAR, ChinaHungaryIcelandIndiaIndonesiaIran, Islamic Rep.IraqIrelandIsraelItalyJamaicaJapanJordanKazakhstanKenyaKiribatiKorea, Rep.KosovoKuwaitKyrgyz RepublicLao PDRLatviaLebanonLesothoLiberiaLibyaLithuaniaLuxembourgMacao SAR, ChinaMacedonia, FYRMadagascarMalawiMalaysiaMaldivesMaliMaltaMarshall IslandsMauritaniaMauritiusMexicoMicronesia, Fed. Sts.MoldovaMongoliaMontenegroMoroccoMozambiqueMyanmarNamibiaNepalNetherlandsNew CaledoniaNew ZealandNicaraguaNigerNigeriaNorwayOmanPakistanPalauPanamaPapua New GuineaParaguayPeruPhilippinesPolandPortugalQatarRomaniaRussian FederationRwandaSamoaSao Tome and PrincipeSaudi ArabiaSenegalSerbiaSeychellesSierra LeoneSingaporeSint Maarten (Dutch part)Slovak RepublicSloveniaSolomon IslandsSouth AfricaSouth SudanSpainSri LankaSt. Kitts and NevisSt. LuciaSt. Vincent and the GrenadinesSudanSurinameSwazilandSwedenSwitzerlandSyrian Arab RepublicTajikistanTanzaniaThailandTimor-LesteTogoTongaTrinidad and TobagoTunisiaTurkeyTuvaluUgandaUkraineUnited KingdomUnited StatesUruguayVanuatuVenezuela, RBVietnamWest Bank and GazaYemen, Rep.ZambiaZimbabwe
La ligne de temps
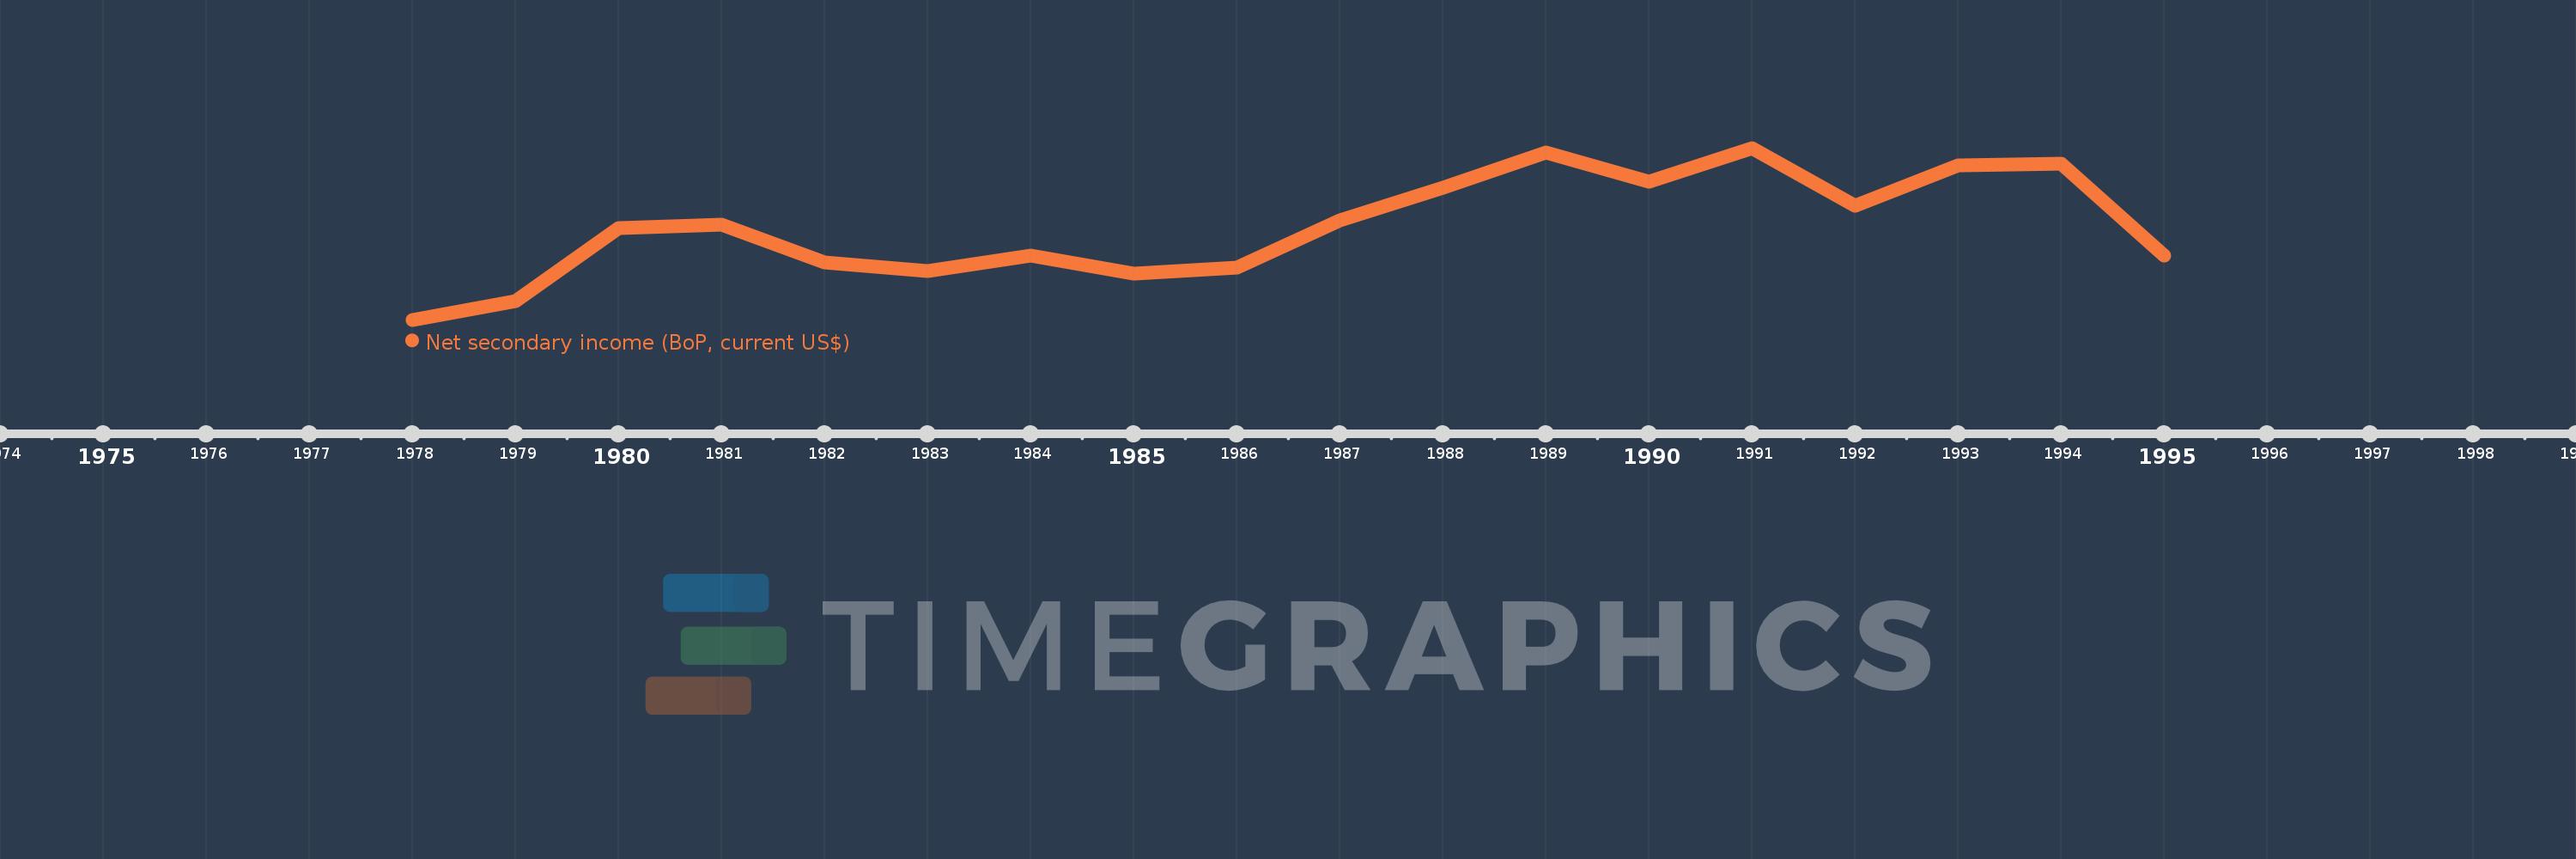
Cette échelle de temps montre un graphique de 1978 année à 1995 année Central African Republic. Les données jusqu'à 1977 année ne sont pas présentés. Quantité d'observations actuelles selon dates: 18.
Source (désignation):
Les indicateurs du développement mondiale
Source (organisation):
International Monetary Fund, Balance of Payments Statistics Yearbook and data files.
Catégories:
Economy & Growth
Dernière mise à jour
23 avr. 2017
Les indicateurs de changement de valeurs selon les années
En moyenne:
79.309 mln.
Minimum:
27.98 mln.
1 janv. 1978
Maximum:
122.994 mln.
1 janv. 1991
Pour la date d''observation
Valeur
Changement absolu
Le changement par rapport à la valeur précédente
1 janv. 1978
27.98 mln.
+27.98 mln.
0.0%
1 janv. 1979
38.497 mln.
+10.517 mln.
37.59%
1 janv. 1980
78.455 mln.
+39.958 mln.
103.8%
1 janv. 1981
80.789 mln.
+2.334 mln.
2.98%
1 janv. 1982
59.75 mln.
-21.039 mln.
-26.04%
1 janv. 1983
54.768 mln.
-4.982 mln.
-8.34%
1 janv. 1984
63.498 mln.
+8.731 mln.
15.94%
1 janv. 1985
53.442 mln.
-10.056 mln.
-15.84%
1 janv. 1986
56.715 mln.
+3.273 mln.
6.12%
1 janv. 1987
82.964 mln.
+26.249 mln.
46.28%
1 janv. 1988
101.089 mln.
+18.125 mln.
21.85%
1 janv. 1989
120.689 mln.
+19.6 mln.
19.39%
1 janv. 1990
104.113 mln.
-16.576 mln.
-13.73%
1 janv. 1991
122.994 mln.
+18.881 mln.
18.14%
1 janv. 1992
90.898 mln.
-32.096 mln.
-26.1%
1 janv. 1993
113.415 mln.
+22.517 mln.
24.77%
1 janv. 1994
114.108 mln.
+692.669 milles
0.61%
1 janv. 1995
63.4 mln.
-50.708 mln.
-44.44%
Classement des pays selon les statistiques actuelles par années

Commentaires:

Envoyer
PremiumAbout & FeedbackUn accordConfidentialité
logo
© 2022 Selected Technologies LLC – Morgan Hill, California