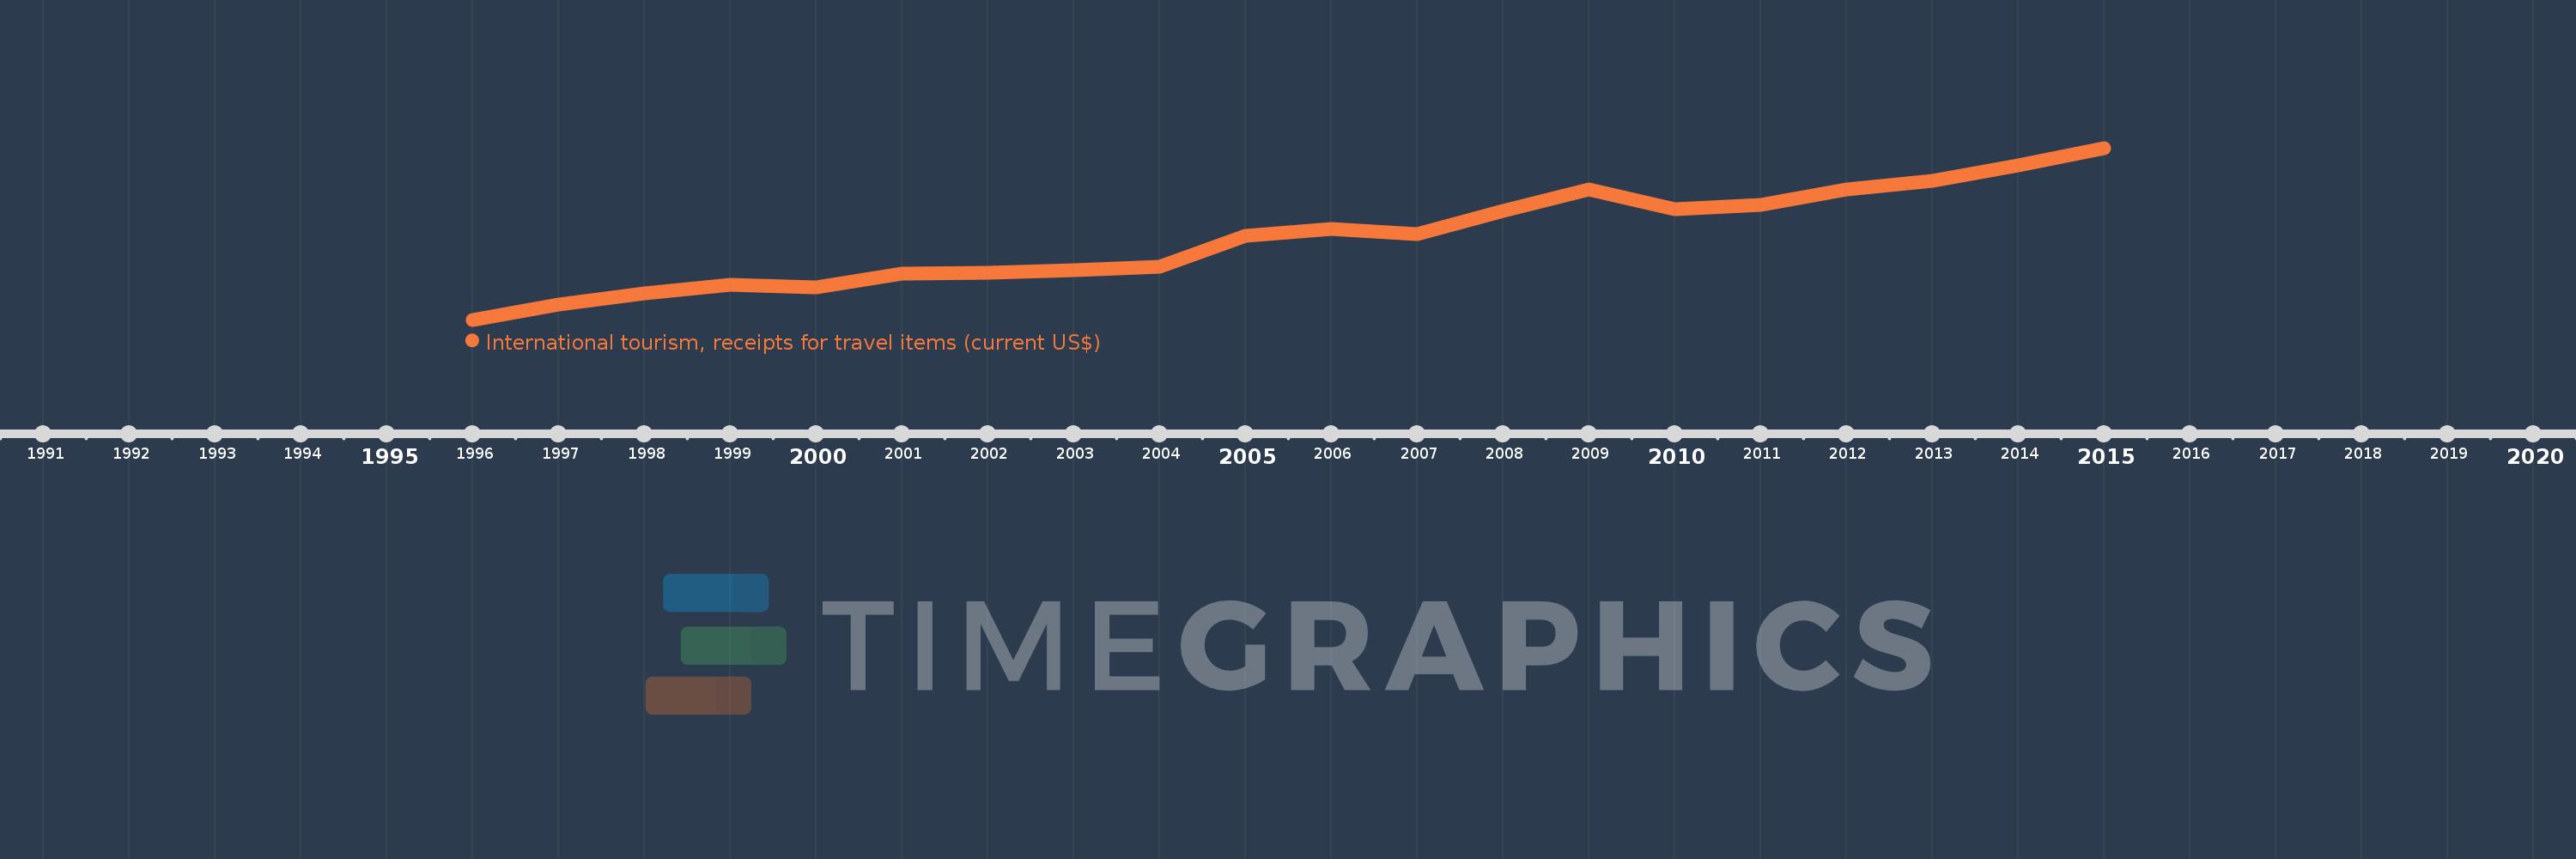
Cette échelle de temps montre un graphique de 1996 année à 2015 année Aruba. Les données jusqu'à 1995 année ne sont pas présentés. Quantité d'observations actuelles selon dates: 20.
Source (désignation):
Les indicateurs du développement mondiale
Source (organisation):
World Tourism Organization, Yearbook of Tourism Statistics, Compendium of Tourism Statistics and data files.
Catégories:
Private Sector, Trade
Dernière mise à jour
23 avr. 2017
Les indicateurs de changement de valeurs selon les années
En moyenne:
1.037 mds
Minimum:
521.0 mln.
1 janv. 1996
Maximum:
1.612 mds
1 janv. 2015
Pour la date d''observation
Valeur
Changement absolu
Le changement par rapport à la valeur précédente
1 janv. 1996
521.0 mln.
+521.0 mln.
0.0%
1 janv. 1997
620.0 mln.
+99.0 mln.
19.0%
1 janv. 1998
689.0 mln.
+69.0 mln.
11.13%
1 janv. 1999
741.0 mln.
+52.0 mln.
7.55%
1 janv. 2000
729.0 mln.
-12.0 mln.
-1.62%
1 janv. 2001
814.0 mln.
+85.0 mln.
11.66%
1 janv. 2002
822.0 mln.
+8.0 mln.
0.98%
1 janv. 2003
834.0 mln.
+12.0 mln.
1.46%
1 janv. 2004
858.0 mln.
+24.0 mln.
2.88%
1 janv. 2005
1.056 mds
+198.0 mln.
23.08%
1 janv. 2006
1.097 mds
+41.0 mln.
3.88%
1 janv. 2007
1.064 mds
-33.0 mln.
-3.01%
1 janv. 2008
1.213 mds
+149.0 mln.
14.0%
1 janv. 2009
1.351 mds
+138.0 mln.
11.38%
1 janv. 2010
1.222 mds
-129.0 mln.
-9.55%
1 janv. 2011
1.251 mds
+29.0 mln.
2.37%
1 janv. 2012
1.351 mds
+100.0 mln.
7.99%
1 janv. 2013
1.402 mds
+51.0 mln.
3.77%
1 janv. 2014
1.501 mds
+99.0 mln.
7.06%
1 janv. 2015
1.612 mds
+111.0 mln.
7.4%
Classement des pays selon les statistiques actuelles par années