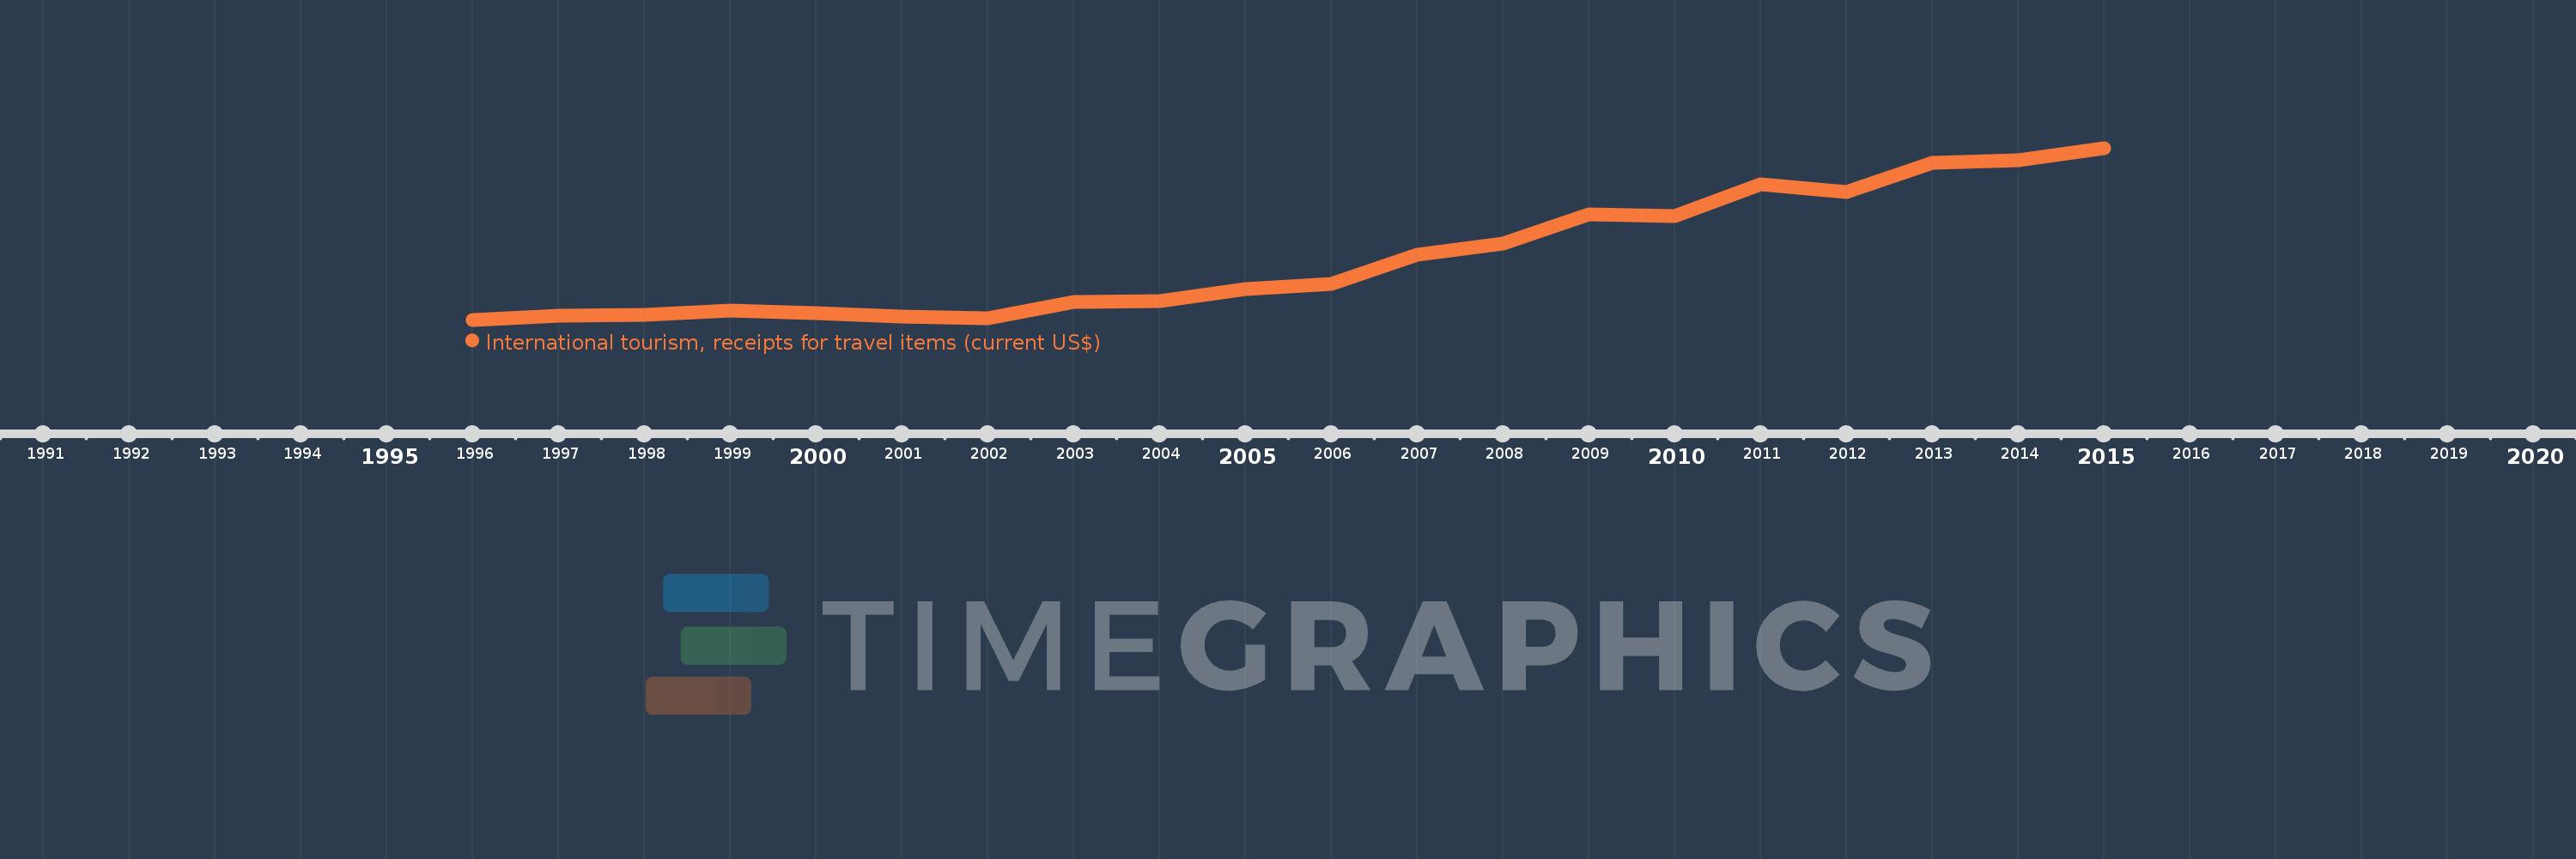
Cette échelle de temps montre un graphique de 1996 année à 2015 année Jordan. Les données jusqu'à 1995 année ne sont pas présentés. Quantité d'observations actuelles selon dates: 20.
Source (désignation):
Les indicateurs du développement mondiale
Source (organisation):
World Tourism Organization, Yearbook of Tourism Statistics, Compendium of Tourism Statistics and data files.
Catégories:
Private Sector, Trade
Dernière mise à jour
23 avr. 2017
Les indicateurs de changement de valeurs selon les années
En moyenne:
1.996 mds
Minimum:
660.0 mln.
1 janv. 1996
Maximum:
4.376 mds
1 janv. 2015
Pour la date d''observation
Valeur
Changement absolu
Le changement par rapport à la valeur précédente
1 janv. 1996
660.0 mln.
+660.0 mln.
0.0%
1 janv. 1997
744.0 mln.
+84.0 mln.
12.73%
1 janv. 1998
774.0 mln.
+30.0 mln.
4.03%
1 janv. 1999
853.0 mln.
+79.0 mln.
10.21%
1 janv. 2000
795.0 mln.
-58.0 mln.
-6.8%
1 janv. 2001
723.0 mln.
-72.0 mln.
-9.06%
1 janv. 2002
700.0 mln.
-23.0 mln.
-3.18%
1 janv. 2003
1.048 mds
+348.0 mln.
49.71%
1 janv. 2004
1.062 mds
+14.0 mln.
1.34%
1 janv. 2005
1.33 mds
+268.0 mln.
25.24%
1 janv. 2006
1.441 mds
+111.0 mln.
8.35%
1 janv. 2007
2.06 mds
+619.0 mln.
42.96%
1 janv. 2008
2.311 mds
+251.0 mln.
12.18%
1 janv. 2009
2.943 mds
+632.0 mln.
27.35%
1 janv. 2010
2.911 mds
-32.0 mln.
-1.09%
1 janv. 2011
3.585 mds
+674.0 mln.
23.15%
1 janv. 2012
3.425 mds
-160.0 mln.
-4.46%
1 janv. 2013
4.061 mds
+636.0 mln.
18.57%
1 janv. 2014
4.117 mds
+56.0 mln.
1.38%
1 janv. 2015
4.376 mds
+259.0 mln.
6.29%
Classement des pays selon les statistiques actuelles par années