29
/fr/
fr
AIzaSyAYiBZKx7MnpbEhh9jyipgxe19OcubqV5w
April 1, 2024
253207
Sudan
SDN
true
2
1
International tourism, receipts for travel items (current US$)
2015,2014,2013,2012,2011,2010,2009,2008,2007,2006,2005,2004,2003,2002,2001,2000,1999,1998,1997,1996
Download
Bibliothèque de statistiques globales →Sudan →

International tourism, receipts for travel items (current US$)

Cette statistique dans les autres pays:
AfghanistanAlbaniaAlgeriaAngolaAntigua and BarbudaArab WorldArgentinaArmeniaArubaAustraliaAustriaAzerbaijanBahamas, TheBahrainBangladeshBarbadosBelarusBelgiumBelizeBeninBermudaBhutanBoliviaBosnia and HerzegovinaBotswanaBrazilBrunei DarussalamBulgariaBurkina FasoBurundiCabo VerdeCambodiaCameroonCanadaCaribbean small statesCentral African RepublicCentral Europe and the BalticsChileChinaColombiaComorosCongo, Dem. Rep.Congo, Rep.Costa RicaCote d'IvoireCroatiaCubaCuracaoCyprusCzech RepublicDenmarkDjiboutiDominicaDominican RepublicEarly-demographic dividendEast Asia & PacificEast Asia & Pacific (excluding high income)East Asia & Pacific (IDA & IBRD countries)EcuadorEgypt, Arab Rep.El SalvadorEstoniaEthiopiaEuro areaEurope & Central AsiaEurope & Central Asia (excluding high income)Europe & Central Asia (IDA & IBRD countries)European UnionFijiFinlandFragile and conflict affected situationsFranceFrench PolynesiaGabonGambia, TheGeorgiaGermanyGhanaGreeceGrenadaGuatemalaGuineaGuinea-BissauGuyanaHaitiHeavily indebted poor countries (HIPC)High incomeHondurasHong Kong SAR, ChinaHungaryIBRD onlyIcelandIDA & IBRD totalIDA blendIDA onlyIDA totalIndiaIndonesiaIran, Islamic Rep.IraqIrelandIsraelItalyJamaicaJapanJordanKazakhstanKenyaKiribatiKorea, Rep.KuwaitKyrgyz RepublicLao PDRLate-demographic dividendLatin America & Caribbean Latin America & Caribbean (excluding high income)Latin America & the Caribbean (IDA & IBRD countries)LatviaLeast developed countries: UN classificationLebanonLesothoLiberiaLibyaLithuaniaLow & middle incomeLower middle incomeLuxembourgMacao SAR, ChinaMacedonia, FYRMadagascarMalawiMalaysiaMaldivesMaliMaltaMarshall IslandsMauritaniaMauritiusMexicoMicronesia, Fed. Sts.Middle East & North AfricaMiddle East & North Africa (excluding high income)Middle East & North Africa (IDA & IBRD countries)Middle incomeMoldovaMongoliaMontenegroMoroccoMozambiqueMyanmarNamibiaNepalNetherlandsNew CaledoniaNew ZealandNicaraguaNigerNigeriaNorth AmericaNorwayOECD membersOmanPacific island small statesPakistanPalauPanamaPapua New GuineaParaguayPeruPhilippinesPolandPortugalPost-demographic dividendPre-demographic dividendQatarRomaniaRussian FederationRwandaSamoaSao Tome and PrincipeSaudi ArabiaSenegalSerbiaSeychellesSierra LeoneSingaporeSint Maarten (Dutch part)Slovak RepublicSloveniaSolomon IslandsSouth AfricaSouth AsiaSouth Asia (IDA & IBRD)SpainSri LankaSt. Kitts and NevisSt. LuciaSt. Vincent and the GrenadinesSub-Saharan Africa Sub-Saharan Africa (excluding high income)Sub-Saharan Africa (IDA & IBRD countries)SudanSurinameSwazilandSwedenSwitzerlandSyrian Arab RepublicTajikistanTanzaniaThailandTimor-LesteTogoTongaTrinidad and TobagoTunisiaTurkeyTurkmenistanTuvaluUgandaUkraineUnited KingdomUnited StatesUpper middle incomeUruguayUzbekistanVanuatuVenezuela, RBWest Bank and GazaWorldYemen, Rep.Zambia
La ligne de temps
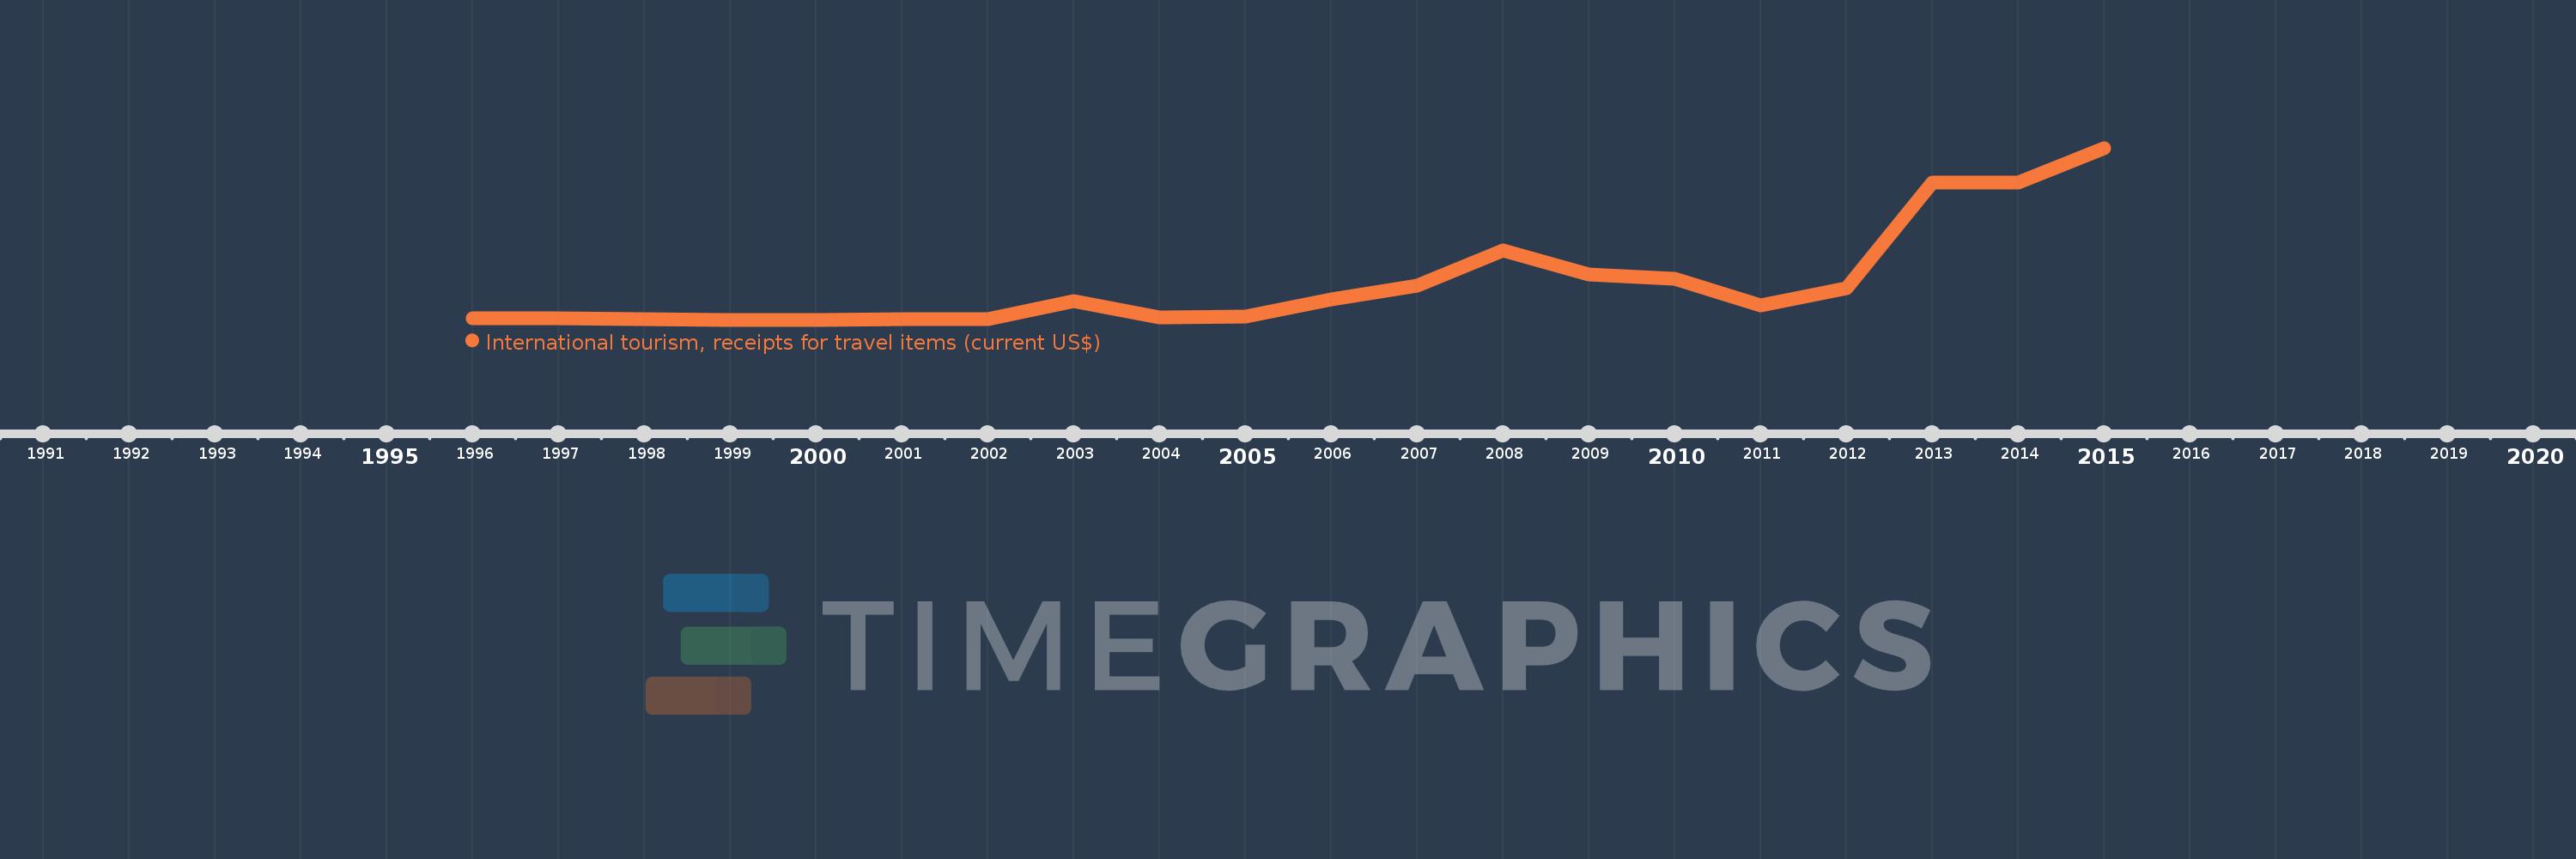
Cette échelle de temps montre un graphique de 1996 année à 2015 année Sudan. Les données jusqu'à 1995 année ne sont pas présentés. Quantité d'observations actuelles selon dates: 20.
Source (désignation):
Les indicateurs du développement mondiale
Source (organisation):
World Tourism Organization, Yearbook of Tourism Statistics, Compendium of Tourism Statistics and data files.
Catégories:
Private Sector, Trade
Dernière mise à jour
23 avr. 2017
Les indicateurs de changement de valeurs selon les années
En moyenne:
206.75 mln.
Minimum:
2.0 mln.
1 janv. 1999
Maximum:
967.0 mln.
1 janv. 2015
Pour la date d''observation
Valeur
Changement absolu
Le changement par rapport à la valeur précédente
1 janv. 1996
8.0 mln.
+8.0 mln.
0.0%
1 janv. 1997
8.0 mln.
0.0
0.0%
1 janv. 1998
4.0 mln.
-4.0 mln.
-50.0%
1 janv. 1999
2.0 mln.
-2.0 mln.
-50.0%
1 janv. 2000
2.0 mln.
0.0
0.0%
1 janv. 2001
5.0 mln.
+3.0 mln.
150.0%
1 janv. 2002
3.0 mln.
-2.0 mln.
-40.0%
1 janv. 2003
108.0 mln.
+105.0 mln.
3.5 milles%
1 janv. 2004
17.0 mln.
-91.0 mln.
-84.26%
1 janv. 2005
21.0 mln.
+4.0 mln.
23.53%
1 janv. 2006
114.0 mln.
+93.0 mln.
442.86%
1 janv. 2007
194.0 mln.
+80.0 mln.
70.18%
1 janv. 2008
390.0 mln.
+196.0 mln.
101.03%
1 janv. 2009
255.0 mln.
-135.0 mln.
-34.62%
1 janv. 2010
231.0 mln.
-24.0 mln.
-9.41%
1 janv. 2011
82.0 mln.
-149.0 mln.
-64.5%
1 janv. 2012
179.0 mln.
+97.0 mln.
118.29%
1 janv. 2013
772.0 mln.
+593.0 mln.
331.28%
1 janv. 2014
773.0 mln.
+1000.0 milles
0.13%
1 janv. 2015
967.0 mln.
+194.0 mln.
25.1%
Classement des pays selon les statistiques actuelles par années

Commentaires:

Envoyer
PremiumAbout & FeedbackUn accordConfidentialité
logo
© 2022 Selected Technologies LLC – Morgan Hill, California