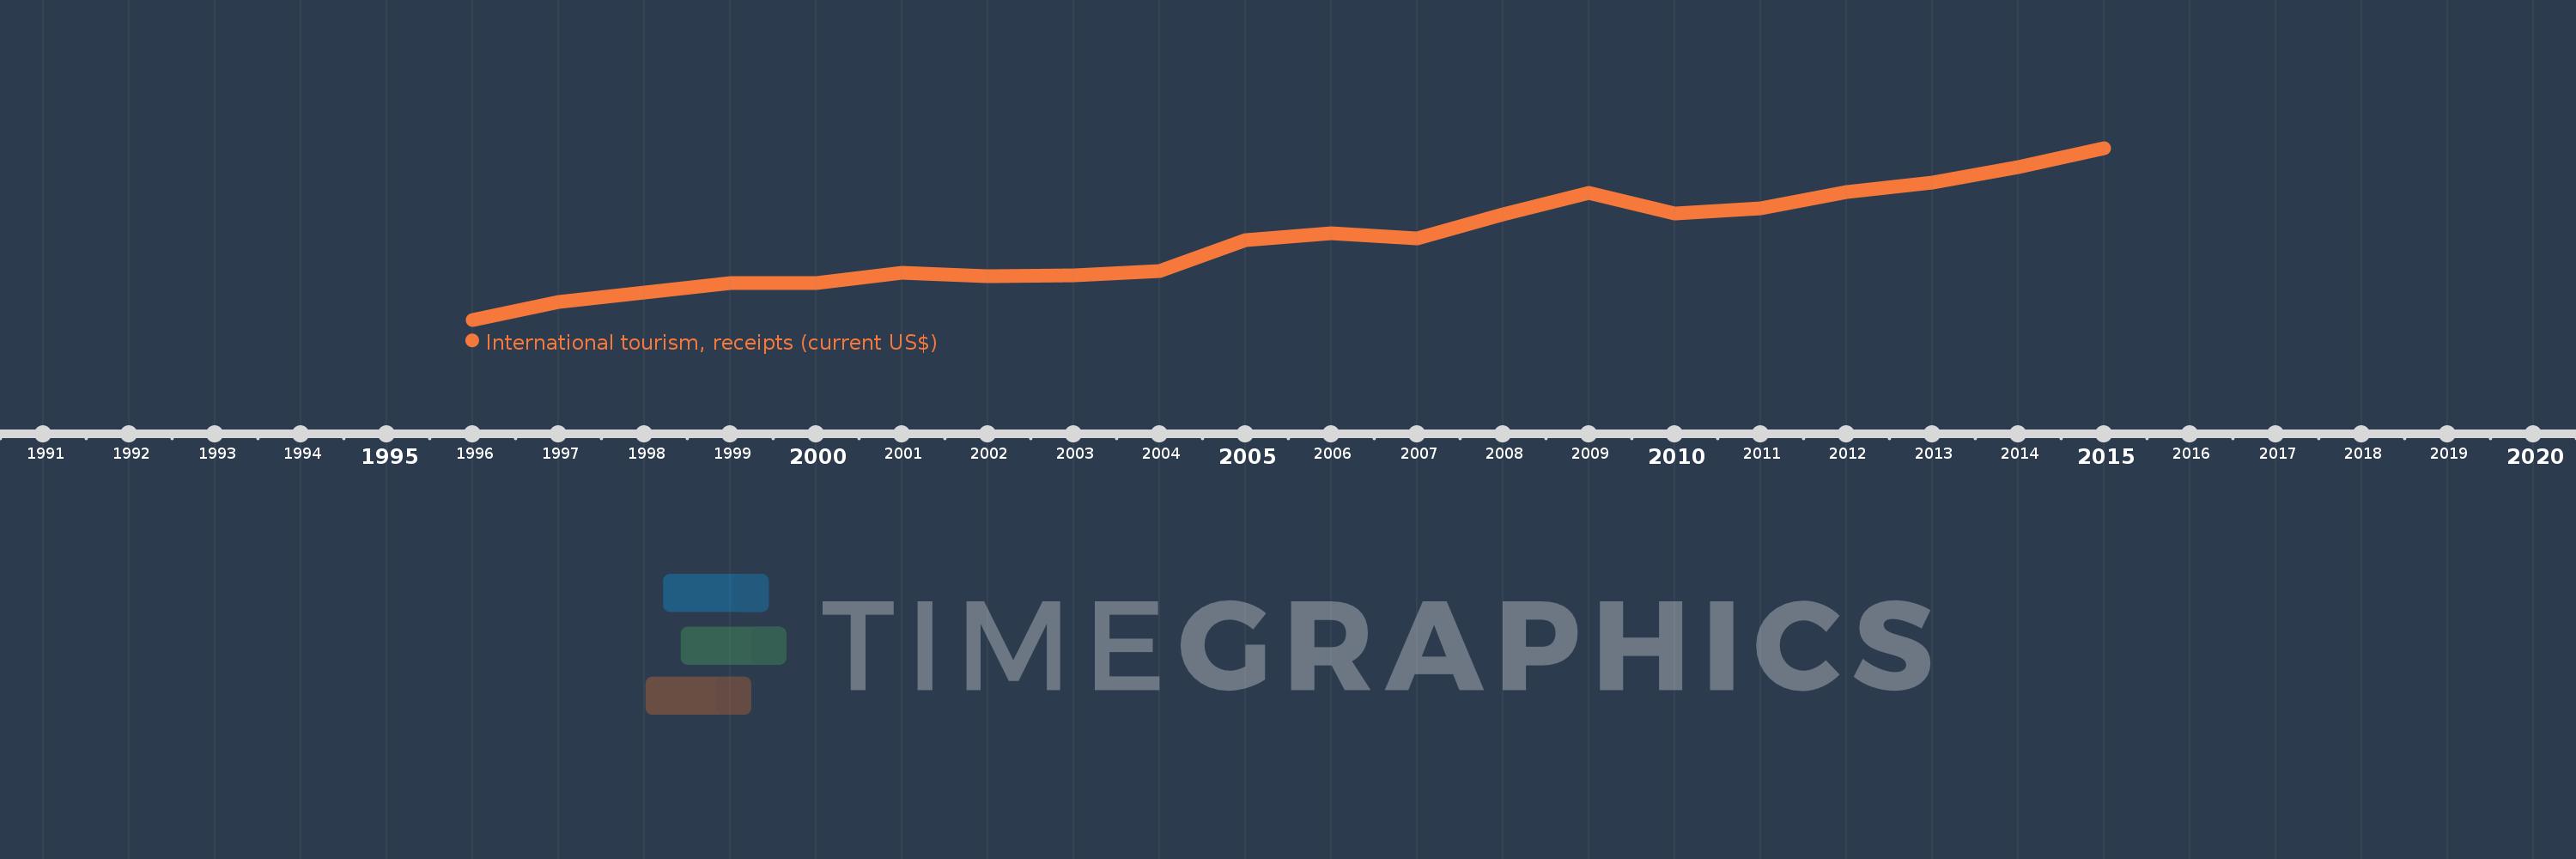
Cette échelle de temps montre un graphique de 1996 année à 2015 année Aruba. Les données jusqu'à 1995 année ne sont pas présentés. Quantité d'observations actuelles selon dates: 20.
Source (désignation):
Les indicateurs du développement mondiale
Source (organisation):
World Tourism Organization, Yearbook of Tourism Statistics, Compendium of Tourism Statistics and data files.
Catégories:
Private Sector, Trade
Dernière mise à jour
23 avr. 2017
Les indicateurs de changement de valeurs selon les années
En moyenne:
1.053 mds
Minimum:
554.0 mln.
1 janv. 1996
Maximum:
1.632 mds
1 janv. 2015
Pour la date d''observation
Valeur
Changement absolu
Le changement par rapport à la valeur précédente
1 janv. 1996
554.0 mln.
+554.0 mln.
0.0%
1 janv. 1997
666.0 mln.
+112.0 mln.
20.22%
1 janv. 1998
726.0 mln.
+60.0 mln.
9.01%
1 janv. 1999
786.0 mln.
+60.0 mln.
8.26%
1 janv. 2000
782.0 mln.
-4.0 mln.
-0.51%
1 janv. 2001
850.0 mln.
+68.0 mln.
8.7%
1 janv. 2002
825.0 mln.
-25.0 mln.
-2.94%
1 janv. 2003
835.0 mln.
+10.0 mln.
1.21%
1 janv. 2004
858.1 mln.
+23.1 mln.
2.77%
1 janv. 2005
1.056 mds
+197.9 mln.
23.06%
1 janv. 2006
1.097 mds
+41.0 mln.
3.88%
1 janv. 2007
1.064 mds
-32.9 mln.
-3.0%
1 janv. 2008
1.213 mds
+149.3 mln.
14.03%
1 janv. 2009
1.352 mds
+138.9 mln.
11.45%
1 janv. 2010
1.223 mds
-129.1 mln.
-9.55%
1 janv. 2011
1.254 mds
+30.9 mln.
2.53%
1 janv. 2012
1.358 mds
+103.5 mln.
8.25%
1 janv. 2013
1.412 mds
+54.5 mln.
4.01%
1 janv. 2014
1.511 mds
+98.7 mln.
6.99%
1 janv. 2015
1.632 mds
+121.1 mln.
8.02%
Classement des pays selon les statistiques actuelles par années