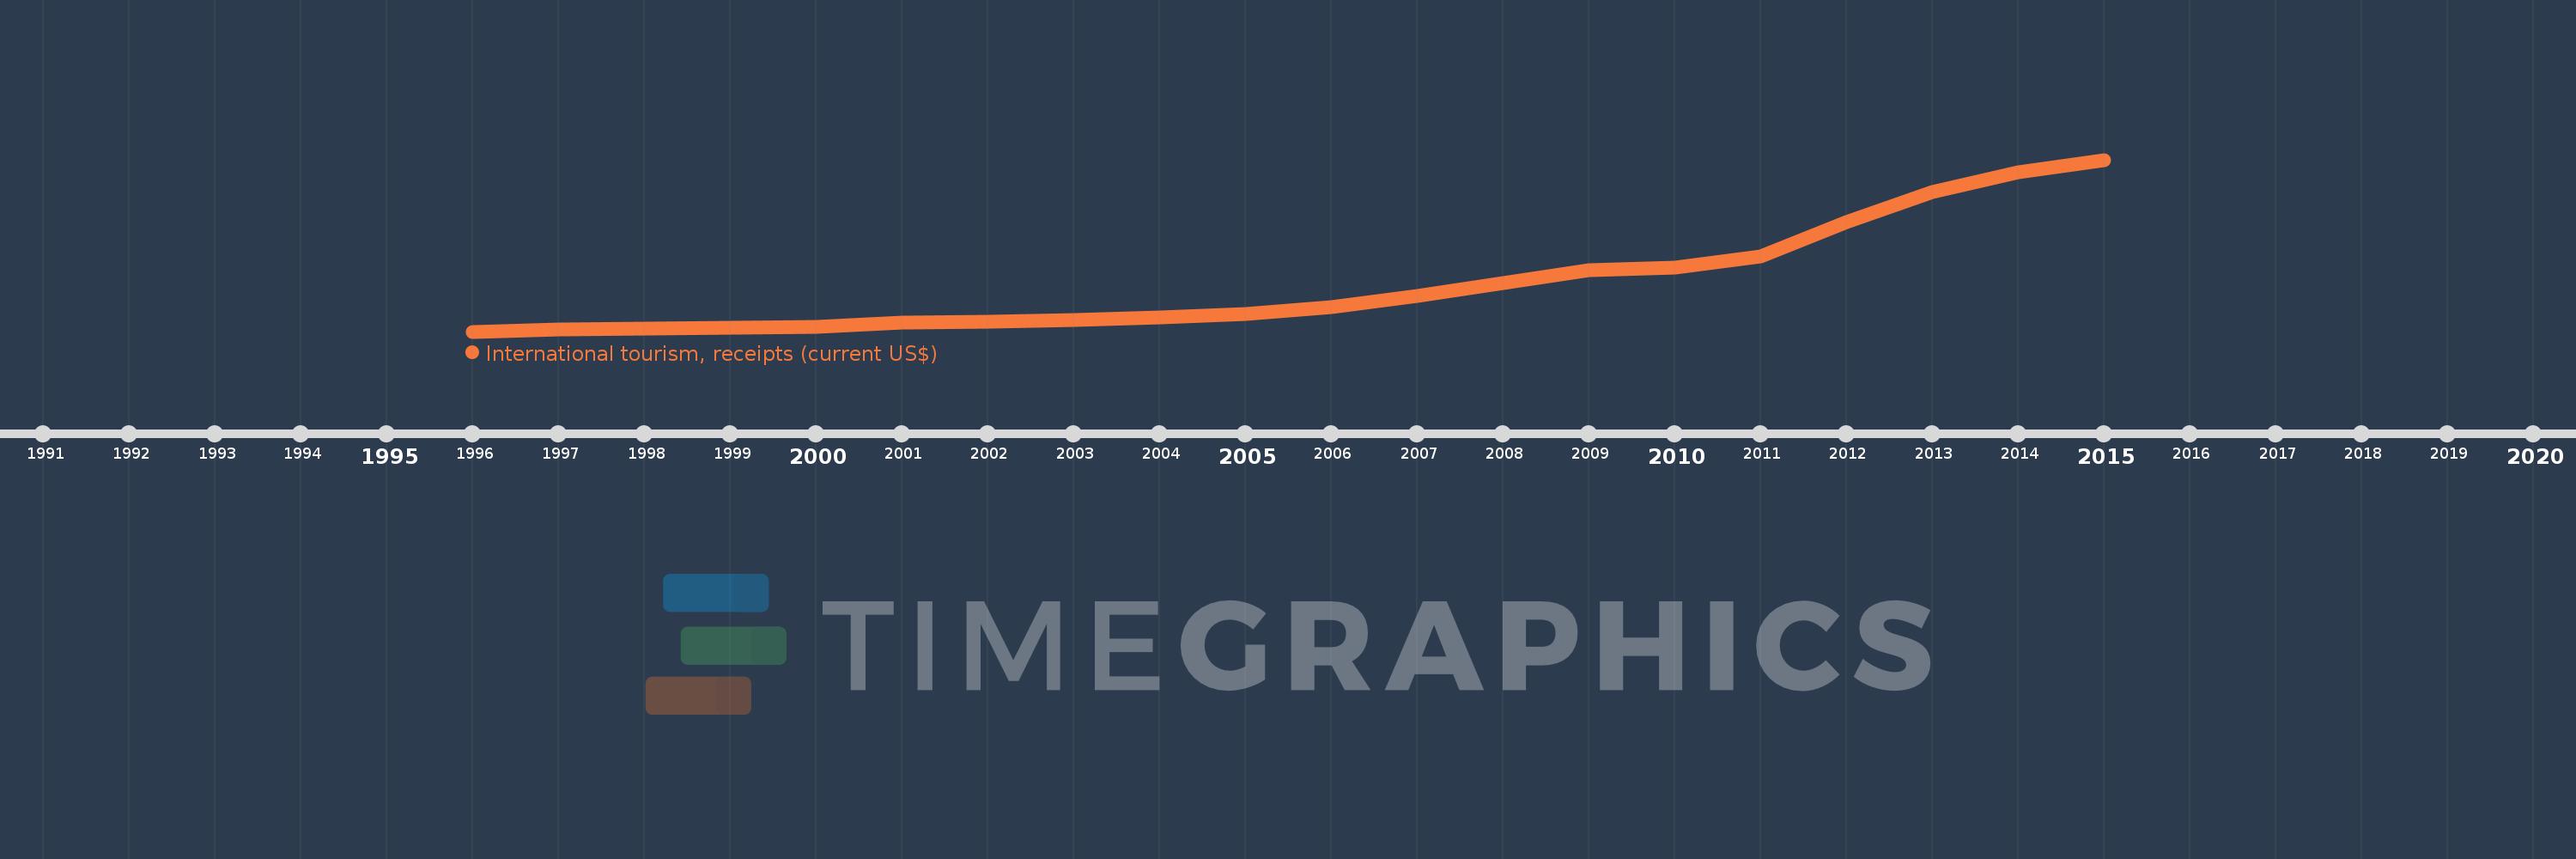
Cette échelle de temps montre un graphique de 1996 année à 2015 année Panama. Les données jusqu'à 1995 année ne sont pas présentés. Quantité d'observations actuelles selon dates: 20.
Source (désignation):
Les indicateurs du développement mondiale
Source (organisation):
World Tourism Organization, Yearbook of Tourism Statistics, Compendium of Tourism Statistics and data files.
Catégories:
Private Sector, Trade
Dernière mise à jour
23 avr. 2017
Les indicateurs de changement de valeurs selon les années
En moyenne:
1.81 mds
Minimum:
372.0 mln.
1 janv. 1996
Maximum:
5.49 mds
1 janv. 2015
Pour la date d''observation
Valeur
Changement absolu
Le changement par rapport à la valeur précédente
1 janv. 1996
372.0 mln.
+372.0 mln.
0.0%
1 janv. 1997
432.0 mln.
+60.0 mln.
16.13%
1 janv. 1998
471.0 mln.
+39.0 mln.
9.03%
1 janv. 1999
492.0 mln.
+21.0 mln.
4.46%
1 janv. 2000
506.0 mln.
+14.0 mln.
2.85%
1 janv. 2001
628.0 mln.
+122.0 mln.
24.11%
1 janv. 2002
665.0 mln.
+37.0 mln.
5.89%
1 janv. 2003
710.0 mln.
+45.0 mln.
6.77%
1 janv. 2004
804.0 mln.
+94.0 mln.
13.24%
1 janv. 2005
903.0 mln.
+99.0 mln.
12.31%
1 janv. 2006
1.108 mds
+205.0 mln.
22.7%
1 janv. 2007
1.425 mds
+317.0 mln.
28.61%
1 janv. 2008
1.806 mds
+381.0 mln.
26.74%
1 janv. 2009
2.208 mds
+402.0 mln.
22.26%
1 janv. 2010
2.28 mds
+72.0 mln.
3.26%
1 janv. 2011
2.621 mds
+341.0 mln.
14.96%
1 janv. 2012
3.63 mds
+1.009 mds
38.5%
1 janv. 2013
4.534 mds
+904.0 mln.
24.9%
1 janv. 2014
5.119 mds
+585.0 mln.
12.9%
1 janv. 2015
5.49 mds
+371.0 mln.
7.25%
Classement des pays selon les statistiques actuelles par années