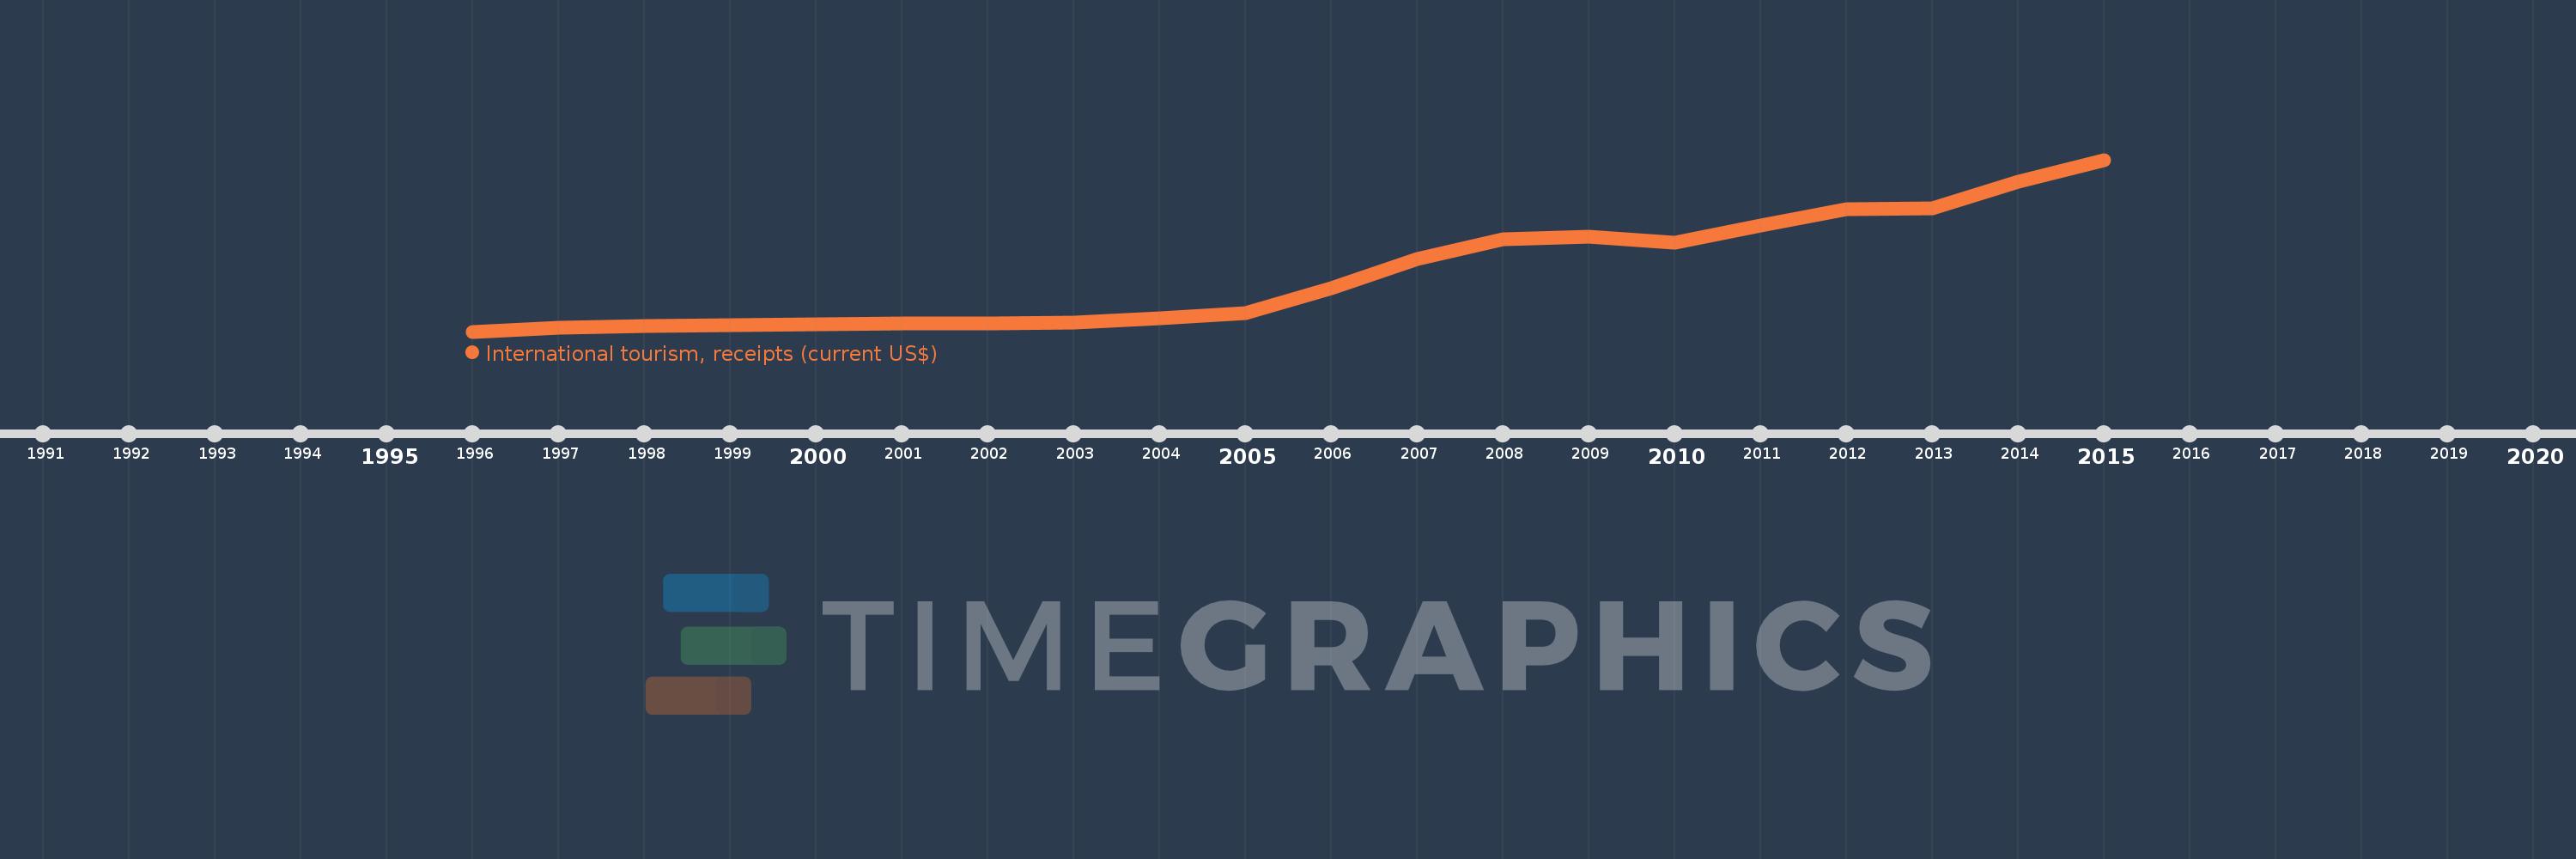
Cette échelle de temps montre un graphique de 1996 année à 2015 année Maldives. Les données jusqu'à 1995 année ne sont pas présentés. Quantité d'observations actuelles selon dates: 20.
Source (désignation):
Les indicateurs du développement mondiale
Source (organisation):
World Tourism Organization, Yearbook of Tourism Statistics, Compendium of Tourism Statistics and data files.
Catégories:
Private Sector, Trade
Dernière mise à jour
23 avr. 2017
Les indicateurs de changement de valeurs selon les années
En moyenne:
1.022 mds
Minimum:
211.0 mln.
1 janv. 1996
Maximum:
2.645 mds
1 janv. 2015
Pour la date d''observation
Valeur
Changement absolu
Le changement par rapport à la valeur précédente
1 janv. 1996
211.0 mln.
+211.0 mln.
0.0%
1 janv. 1997
266.0 mln.
+55.0 mln.
26.07%
1 janv. 1998
286.0 mln.
+20.0 mln.
7.52%
1 janv. 1999
303.0 mln.
+17.0 mln.
5.94%
1 janv. 2000
314.0 mln.
+11.0 mln.
3.63%
1 janv. 2001
321.0 mln.
+7.0 mln.
2.23%
1 janv. 2002
327.0 mln.
+6.0 mln.
1.87%
1 janv. 2003
337.0 mln.
+10.0 mln.
3.06%
1 janv. 2004
402.0 mln.
+65.0 mln.
19.29%
1 janv. 2005
471.0 mln.
+69.0 mln.
17.16%
1 janv. 2006
826.0 mln.
+355.0 mln.
75.37%
1 janv. 2007
1.235 mds
+409.0 mln.
49.52%
1 janv. 2008
1.515 mds
+280.0 mln.
22.67%
1 janv. 2009
1.559 mds
+44.0 mln.
2.9%
1 janv. 2010
1.473 mds
-86.0 mln.
-5.52%
1 janv. 2011
1.713 mds
+240.0 mln.
16.29%
1 janv. 2012
1.94 mds
+227.0 mln.
13.25%
1 janv. 2013
1.958 mds
+18.0 mln.
0.93%
1 janv. 2014
2.337 mds
+379.0 mln.
19.36%
1 janv. 2015
2.645 mds
+308.0 mln.
13.18%
Classement des pays selon les statistiques actuelles par années