29
/fr/
fr
AIzaSyAYiBZKx7MnpbEhh9jyipgxe19OcubqV5w
April 1, 2024
46260
Low income
LIC
false
2
1
Labor force, total
2015,2014,2013,2012,2011,2010,2009,2008,2007,2006,2005,2004,2003,2002,2001,2000,1999,1998,1997,1996,1995,1994,1993,1992,1991
Download
Bibliothèque de statistiques globales →Low income →

Labor force, total

Cette statistique dans les autres pays:
AfghanistanAlbaniaAlgeriaAngolaArab WorldArgentinaArmeniaAustraliaAustriaAzerbaijanBahamas, TheBahrainBangladeshBarbadosBelarusBelgiumBelizeBeninBhutanBoliviaBosnia and HerzegovinaBotswanaBrazilBrunei DarussalamBulgariaBurkina FasoBurundiCabo VerdeCambodiaCameroonCanadaCaribbean small statesCentral African RepublicCentral Europe and the BalticsChadChannel IslandsChileChinaColombiaComorosCongo, Dem. Rep.Congo, Rep.Costa RicaCote d'IvoireCroatiaCubaCyprusCzech RepublicDenmarkDjiboutiDominican RepublicEarly-demographic dividendEast Asia & PacificEast Asia & Pacific (excluding high income)East Asia & Pacific (IDA & IBRD countries)EcuadorEgypt, Arab Rep.El SalvadorEquatorial GuineaEritreaEstoniaEthiopiaEuro areaEurope & Central AsiaEurope & Central Asia (excluding high income)Europe & Central Asia (IDA & IBRD countries)European UnionFijiFinlandFragile and conflict affected situationsFranceFrench PolynesiaGabonGambia, TheGeorgiaGermanyGhanaGreeceGuamGuatemalaGuineaGuinea-BissauGuyanaHaitiHeavily indebted poor countries (HIPC)High incomeHondurasHong Kong SAR, ChinaHungaryIBRD onlyIcelandIDA & IBRD totalIDA blendIDA onlyIDA totalIndiaIndonesiaIran, Islamic Rep.IraqIrelandIsraelItalyJamaicaJapanJordanKazakhstanKenyaKorea, Dem. People’s Rep.Korea, Rep.KuwaitKyrgyz RepublicLao PDRLate-demographic dividendLatin America & Caribbean Latin America & Caribbean (excluding high income)Latin America & the Caribbean (IDA & IBRD countries)LatviaLeast developed countries: UN classificationLebanonLesothoLiberiaLibyaLithuaniaLow & middle incomeLow incomeLower middle incomeLuxembourgMacao SAR, ChinaMacedonia, FYRMadagascarMalawiMalaysiaMaldivesMaliMaltaMauritaniaMauritiusMexicoMiddle East & North AfricaMiddle East & North Africa (excluding high income)Middle East & North Africa (IDA & IBRD countries)Middle incomeMoldovaMongoliaMontenegroMoroccoMozambiqueMyanmarNamibiaNepalNetherlandsNew CaledoniaNew ZealandNicaraguaNigerNigeriaNorth AmericaNorwayOECD membersOmanOther small statesPacific island small statesPakistanPanamaPapua New GuineaParaguayPeruPhilippinesPolandPortugalPost-demographic dividendPre-demographic dividendPuerto RicoQatarRomaniaRussian FederationRwandaSamoaSao Tome and PrincipeSaudi ArabiaSenegalSerbiaSierra LeoneSingaporeSlovak RepublicSloveniaSmall statesSolomon IslandsSomaliaSouth AfricaSouth AsiaSouth Asia (IDA & IBRD)SpainSri LankaSt. LuciaSt. Vincent and the GrenadinesSub-Saharan Africa Sub-Saharan Africa (excluding high income)Sub-Saharan Africa (IDA & IBRD countries)SudanSurinameSwazilandSwedenSwitzerlandSyrian Arab RepublicTajikistanTanzaniaThailandTimor-LesteTogoTongaTrinidad and TobagoTunisiaTurkeyTurkmenistanUgandaUkraineUnited Arab EmiratesUnited KingdomUnited StatesUpper middle incomeUruguayUzbekistanVanuatuVenezuela, RBVietnamVirgin Islands (U.S.)West Bank and GazaWorldYemen, Rep.ZambiaZimbabwe
La ligne de temps
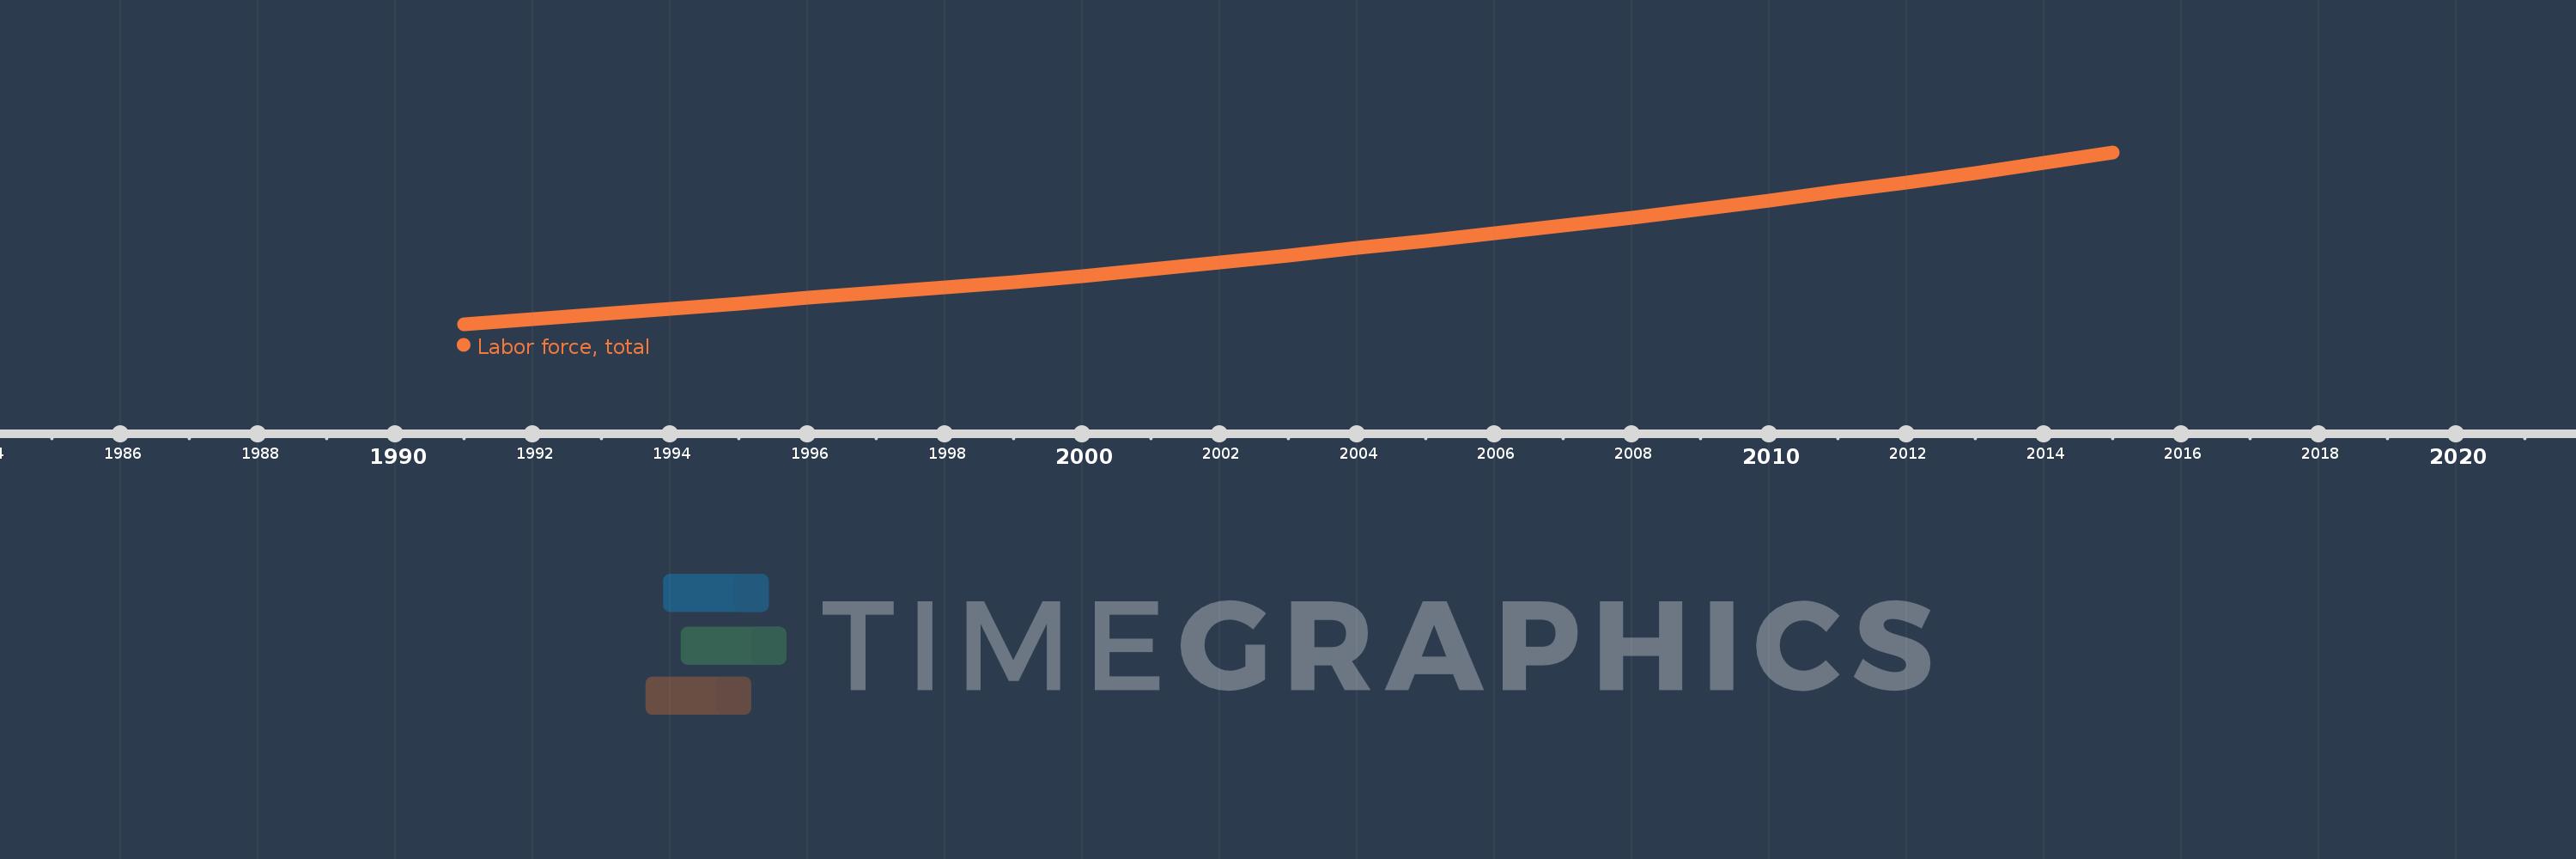
Cette échelle de temps montre un graphique de 1991 année à 2015 année Low income. Les données jusqu'à 1990 année ne sont pas présentés. Quantité d'observations actuelles selon dates: 25.
Source (désignation):
Les indicateurs du développement mondiale
Source (organisation):
International Labour Organization, using World Bank population estimates.
Catégories:
Education, Social Protection & Labor
Dernière mise à jour
23 avr. 2017
Les indicateurs de changement de valeurs selon les années
En moyenne:
192.729 mln.
Minimum:
133.834 mln.
1 janv. 1991
Maximum:
268.717 mln.
1 janv. 2015
Pour la date d''observation
Valeur
Changement absolu
Le changement par rapport à la valeur précédente
1 janv. 1991
133.834 mln.
+133.834 mln.
0.0%
1 janv. 1992
137.633 mln.
+3.798 mln.
2.84%
1 janv. 1993
141.678 mln.
+4.045 mln.
2.94%
1 janv. 1994
145.835 mln.
+4.157 mln.
2.93%
1 janv. 1995
150.126 mln.
+4.29 mln.
2.94%
1 janv. 1996
154.553 mln.
+4.427 mln.
2.95%
1 janv. 1997
158.476 mln.
+3.923 mln.
2.54%
1 janv. 1998
162.63 mln.
+4.154 mln.
2.62%
1 janv. 1999
167.057 mln.
+4.427 mln.
2.72%
1 janv. 2000
171.639 mln.
+4.581 mln.
2.74%
1 janv. 2001
176.958 mln.
+5.319 mln.
3.1%
1 janv. 2002
182.244 mln.
+5.287 mln.
2.99%
1 janv. 2003
187.883 mln.
+5.639 mln.
3.09%
1 janv. 2004
193.623 mln.
+5.74 mln.
3.05%
1 janv. 2005
199.511 mln.
+5.888 mln.
3.04%
1 janv. 2006
205.573 mln.
+6.063 mln.
3.04%
1 janv. 2007
211.499 mln.
+5.926 mln.
2.88%
1 janv. 2008
217.605 mln.
+6.106 mln.
2.89%
1 janv. 2009
224.037 mln.
+6.431 mln.
2.96%
1 janv. 2010
230.868 mln.
+6.832 mln.
3.05%
1 janv. 2011
237.999 mln.
+7.13 mln.
3.09%
1 janv. 2012
245.114 mln.
+7.115 mln.
2.99%
1 janv. 2013
252.675 mln.
+7.561 mln.
3.08%
1 janv. 2014
260.47 mln.
+7.795 mln.
3.08%
1 janv. 2015
268.717 mln.
+8.247 mln.
3.17%
Classement des pays selon les statistiques actuelles par années

Commentaires:

Envoyer
PremiumAbout & FeedbackUn accordConfidentialité
logo
© 2022 Selected Technologies LLC – Morgan Hill, California