29
/fr/
fr
AIzaSyAYiBZKx7MnpbEhh9jyipgxe19OcubqV5w
April 1, 2024
38294
IDA blend
IDB
false
2
1
Labor force, total
2015,2014,2013,2012,2011,2010,2009,2008,2007,2006,2005,2004,2003,2002,2001,2000,1999,1998,1997,1996,1995,1994,1993,1992,1991
Download
Bibliothèque de statistiques globales →IDA blend →

Labor force, total

Cette statistique dans les autres pays:
AfghanistanAlbaniaAlgeriaAngolaArab WorldArgentinaArmeniaAustraliaAustriaAzerbaijanBahamas, TheBahrainBangladeshBarbadosBelarusBelgiumBelizeBeninBhutanBoliviaBosnia and HerzegovinaBotswanaBrazilBrunei DarussalamBulgariaBurkina FasoBurundiCabo VerdeCambodiaCameroonCanadaCaribbean small statesCentral African RepublicCentral Europe and the BalticsChadChannel IslandsChileChinaColombiaComorosCongo, Dem. Rep.Congo, Rep.Costa RicaCote d'IvoireCroatiaCubaCyprusCzech RepublicDenmarkDjiboutiDominican RepublicEarly-demographic dividendEast Asia & PacificEast Asia & Pacific (excluding high income)East Asia & Pacific (IDA & IBRD countries)EcuadorEgypt, Arab Rep.El SalvadorEquatorial GuineaEritreaEstoniaEthiopiaEuro areaEurope & Central AsiaEurope & Central Asia (excluding high income)Europe & Central Asia (IDA & IBRD countries)European UnionFijiFinlandFragile and conflict affected situationsFranceFrench PolynesiaGabonGambia, TheGeorgiaGermanyGhanaGreeceGuamGuatemalaGuineaGuinea-BissauGuyanaHaitiHeavily indebted poor countries (HIPC)High incomeHondurasHong Kong SAR, ChinaHungaryIBRD onlyIcelandIDA & IBRD totalIDA blendIDA onlyIDA totalIndiaIndonesiaIran, Islamic Rep.IraqIrelandIsraelItalyJamaicaJapanJordanKazakhstanKenyaKorea, Dem. People’s Rep.Korea, Rep.KuwaitKyrgyz RepublicLao PDRLate-demographic dividendLatin America & Caribbean Latin America & Caribbean (excluding high income)Latin America & the Caribbean (IDA & IBRD countries)LatviaLeast developed countries: UN classificationLebanonLesothoLiberiaLibyaLithuaniaLow & middle incomeLow incomeLower middle incomeLuxembourgMacao SAR, ChinaMacedonia, FYRMadagascarMalawiMalaysiaMaldivesMaliMaltaMauritaniaMauritiusMexicoMiddle East & North AfricaMiddle East & North Africa (excluding high income)Middle East & North Africa (IDA & IBRD countries)Middle incomeMoldovaMongoliaMontenegroMoroccoMozambiqueMyanmarNamibiaNepalNetherlandsNew CaledoniaNew ZealandNicaraguaNigerNigeriaNorth AmericaNorwayOECD membersOmanOther small statesPacific island small statesPakistanPanamaPapua New GuineaParaguayPeruPhilippinesPolandPortugalPost-demographic dividendPre-demographic dividendPuerto RicoQatarRomaniaRussian FederationRwandaSamoaSao Tome and PrincipeSaudi ArabiaSenegalSerbiaSierra LeoneSingaporeSlovak RepublicSloveniaSmall statesSolomon IslandsSomaliaSouth AfricaSouth AsiaSouth Asia (IDA & IBRD)SpainSri LankaSt. LuciaSt. Vincent and the GrenadinesSub-Saharan Africa Sub-Saharan Africa (excluding high income)Sub-Saharan Africa (IDA & IBRD countries)SudanSurinameSwazilandSwedenSwitzerlandSyrian Arab RepublicTajikistanTanzaniaThailandTimor-LesteTogoTongaTrinidad and TobagoTunisiaTurkeyTurkmenistanUgandaUkraineUnited Arab EmiratesUnited KingdomUnited StatesUpper middle incomeUruguayUzbekistanVanuatuVenezuela, RBVietnamVirgin Islands (U.S.)West Bank and GazaWorldYemen, Rep.ZambiaZimbabwe
La ligne de temps
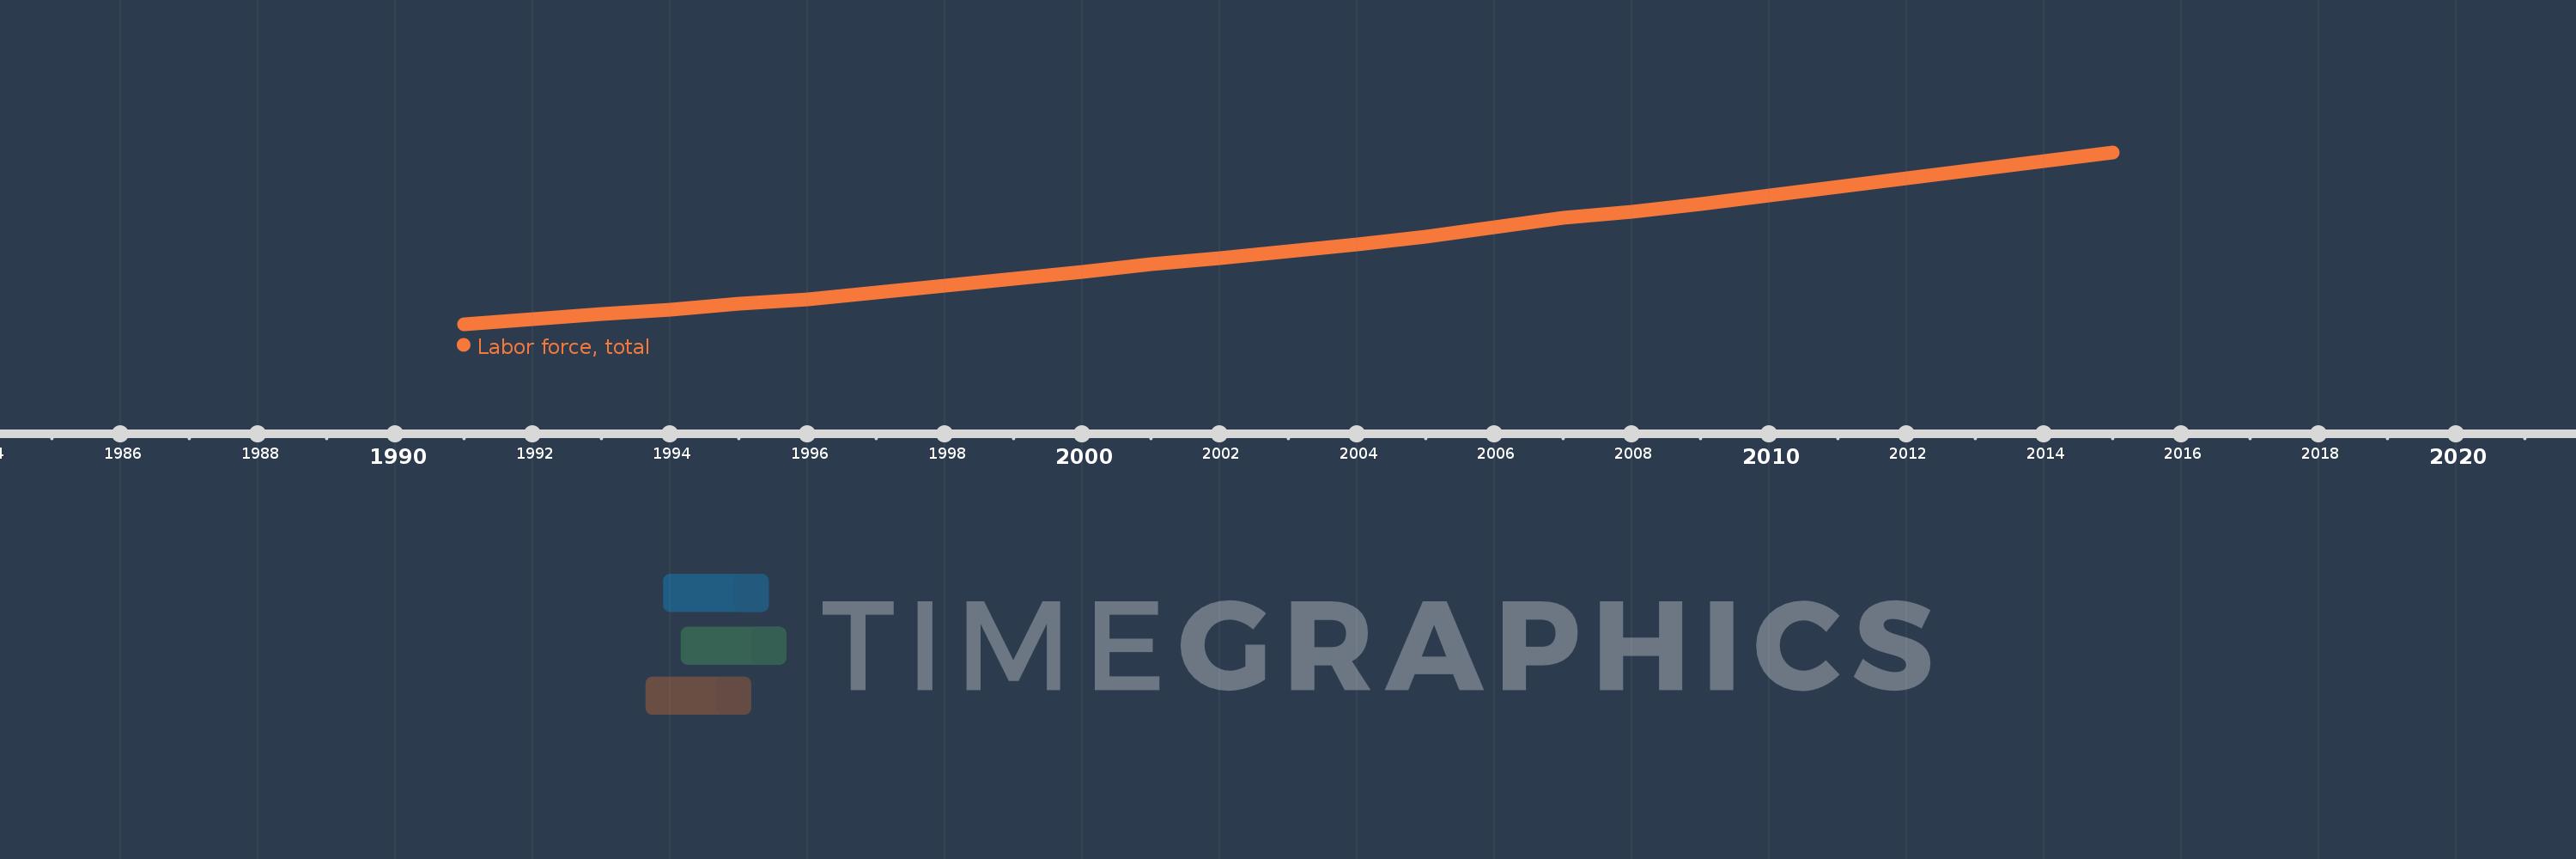
Cette échelle de temps montre un graphique de 1991 année à 2015 année IDA blend. Les données jusqu'à 1990 année ne sont pas présentés. Quantité d'observations actuelles selon dates: 25.
Source (désignation):
Les indicateurs du développement mondiale
Source (organisation):
International Labour Organization, using World Bank population estimates.
Catégories:
Education, Social Protection & Labor
Dernière mise à jour
23 avr. 2017
Les indicateurs de changement de valeurs selon les années
En moyenne:
171.429 mln.
Minimum:
124.488 mln.
1 janv. 1991
Maximum:
227.998 mln.
1 janv. 2015
Pour la date d''observation
Valeur
Changement absolu
Le changement par rapport à la valeur précédente
1 janv. 1991
124.488 mln.
+124.488 mln.
0.0%
1 janv. 1992
127.421 mln.
+2.933 mln.
2.36%
1 janv. 1993
130.531 mln.
+3.11 mln.
2.44%
1 janv. 1994
133.454 mln.
+2.923 mln.
2.24%
1 janv. 1995
137.025 mln.
+3.57 mln.
2.68%
1 janv. 1996
139.619 mln.
+2.594 mln.
1.89%
1 janv. 1997
143.499 mln.
+3.881 mln.
2.78%
1 janv. 1998
147.802 mln.
+4.303 mln.
3.0%
1 janv. 1999
151.989 mln.
+4.187 mln.
2.83%
1 janv. 2000
156.056 mln.
+4.067 mln.
2.68%
1 janv. 2001
160.429 mln.
+4.373 mln.
2.8%
1 janv. 2002
164.35 mln.
+3.921 mln.
2.44%
1 janv. 2003
168.401 mln.
+4.051 mln.
2.46%
1 janv. 2004
172.685 mln.
+4.284 mln.
2.54%
1 janv. 2005
177.277 mln.
+4.592 mln.
2.66%
1 janv. 2006
182.741 mln.
+5.464 mln.
3.08%
1 janv. 2007
188.507 mln.
+5.765 mln.
3.15%
1 janv. 2008
192.354 mln.
+3.848 mln.
2.04%
1 janv. 2009
196.878 mln.
+4.524 mln.
2.35%
1 janv. 2010
202.117 mln.
+5.238 mln.
2.66%
1 janv. 2011
207.368 mln.
+5.251 mln.
2.6%
1 janv. 2012
212.463 mln.
+5.095 mln.
2.46%
1 janv. 2013
217.454 mln.
+4.99 mln.
2.35%
1 janv. 2014
222.814 mln.
+5.36 mln.
2.47%
1 janv. 2015
227.998 mln.
+5.185 mln.
2.33%
Classement des pays selon les statistiques actuelles par années

Commentaires:

Envoyer
PremiumAbout & FeedbackUn accordConfidentialité
logo
© 2022 Selected Technologies LLC – Morgan Hill, California