29
/fr/
fr
AIzaSyAYiBZKx7MnpbEhh9jyipgxe19OcubqV5w
April 1, 2024
30835
Europe & Central Asia
ECS
false
2
1
Labor force, total
2015,2014,2013,2012,2011,2010,2009,2008,2007,2006,2005,2004,2003,2002,2001,2000,1999,1998,1997,1996,1995,1994,1993,1992,1991
Download
Bibliothèque de statistiques globales →Europe & Central Asia →

Labor force, total

Cette statistique dans les autres pays:
AfghanistanAlbaniaAlgeriaAngolaArab WorldArgentinaArmeniaAustraliaAustriaAzerbaijanBahamas, TheBahrainBangladeshBarbadosBelarusBelgiumBelizeBeninBhutanBoliviaBosnia and HerzegovinaBotswanaBrazilBrunei DarussalamBulgariaBurkina FasoBurundiCabo VerdeCambodiaCameroonCanadaCaribbean small statesCentral African RepublicCentral Europe and the BalticsChadChannel IslandsChileChinaColombiaComorosCongo, Dem. Rep.Congo, Rep.Costa RicaCote d'IvoireCroatiaCubaCyprusCzech RepublicDenmarkDjiboutiDominican RepublicEarly-demographic dividendEast Asia & PacificEast Asia & Pacific (excluding high income)East Asia & Pacific (IDA & IBRD countries)EcuadorEgypt, Arab Rep.El SalvadorEquatorial GuineaEritreaEstoniaEthiopiaEuro areaEurope & Central AsiaEurope & Central Asia (excluding high income)Europe & Central Asia (IDA & IBRD countries)European UnionFijiFinlandFragile and conflict affected situationsFranceFrench PolynesiaGabonGambia, TheGeorgiaGermanyGhanaGreeceGuamGuatemalaGuineaGuinea-BissauGuyanaHaitiHeavily indebted poor countries (HIPC)High incomeHondurasHong Kong SAR, ChinaHungaryIBRD onlyIcelandIDA & IBRD totalIDA blendIDA onlyIDA totalIndiaIndonesiaIran, Islamic Rep.IraqIrelandIsraelItalyJamaicaJapanJordanKazakhstanKenyaKorea, Dem. People’s Rep.Korea, Rep.KuwaitKyrgyz RepublicLao PDRLate-demographic dividendLatin America & Caribbean Latin America & Caribbean (excluding high income)Latin America & the Caribbean (IDA & IBRD countries)LatviaLeast developed countries: UN classificationLebanonLesothoLiberiaLibyaLithuaniaLow & middle incomeLow incomeLower middle incomeLuxembourgMacao SAR, ChinaMacedonia, FYRMadagascarMalawiMalaysiaMaldivesMaliMaltaMauritaniaMauritiusMexicoMiddle East & North AfricaMiddle East & North Africa (excluding high income)Middle East & North Africa (IDA & IBRD countries)Middle incomeMoldovaMongoliaMontenegroMoroccoMozambiqueMyanmarNamibiaNepalNetherlandsNew CaledoniaNew ZealandNicaraguaNigerNigeriaNorth AmericaNorwayOECD membersOmanOther small statesPacific island small statesPakistanPanamaPapua New GuineaParaguayPeruPhilippinesPolandPortugalPost-demographic dividendPre-demographic dividendPuerto RicoQatarRomaniaRussian FederationRwandaSamoaSao Tome and PrincipeSaudi ArabiaSenegalSerbiaSierra LeoneSingaporeSlovak RepublicSloveniaSmall statesSolomon IslandsSomaliaSouth AfricaSouth AsiaSouth Asia (IDA & IBRD)SpainSri LankaSt. LuciaSt. Vincent and the GrenadinesSub-Saharan Africa Sub-Saharan Africa (excluding high income)Sub-Saharan Africa (IDA & IBRD countries)SudanSurinameSwazilandSwedenSwitzerlandSyrian Arab RepublicTajikistanTanzaniaThailandTimor-LesteTogoTongaTrinidad and TobagoTunisiaTurkeyTurkmenistanUgandaUkraineUnited Arab EmiratesUnited KingdomUnited StatesUpper middle incomeUruguayUzbekistanVanuatuVenezuela, RBVietnamVirgin Islands (U.S.)West Bank and GazaWorldYemen, Rep.ZambiaZimbabwe
La ligne de temps
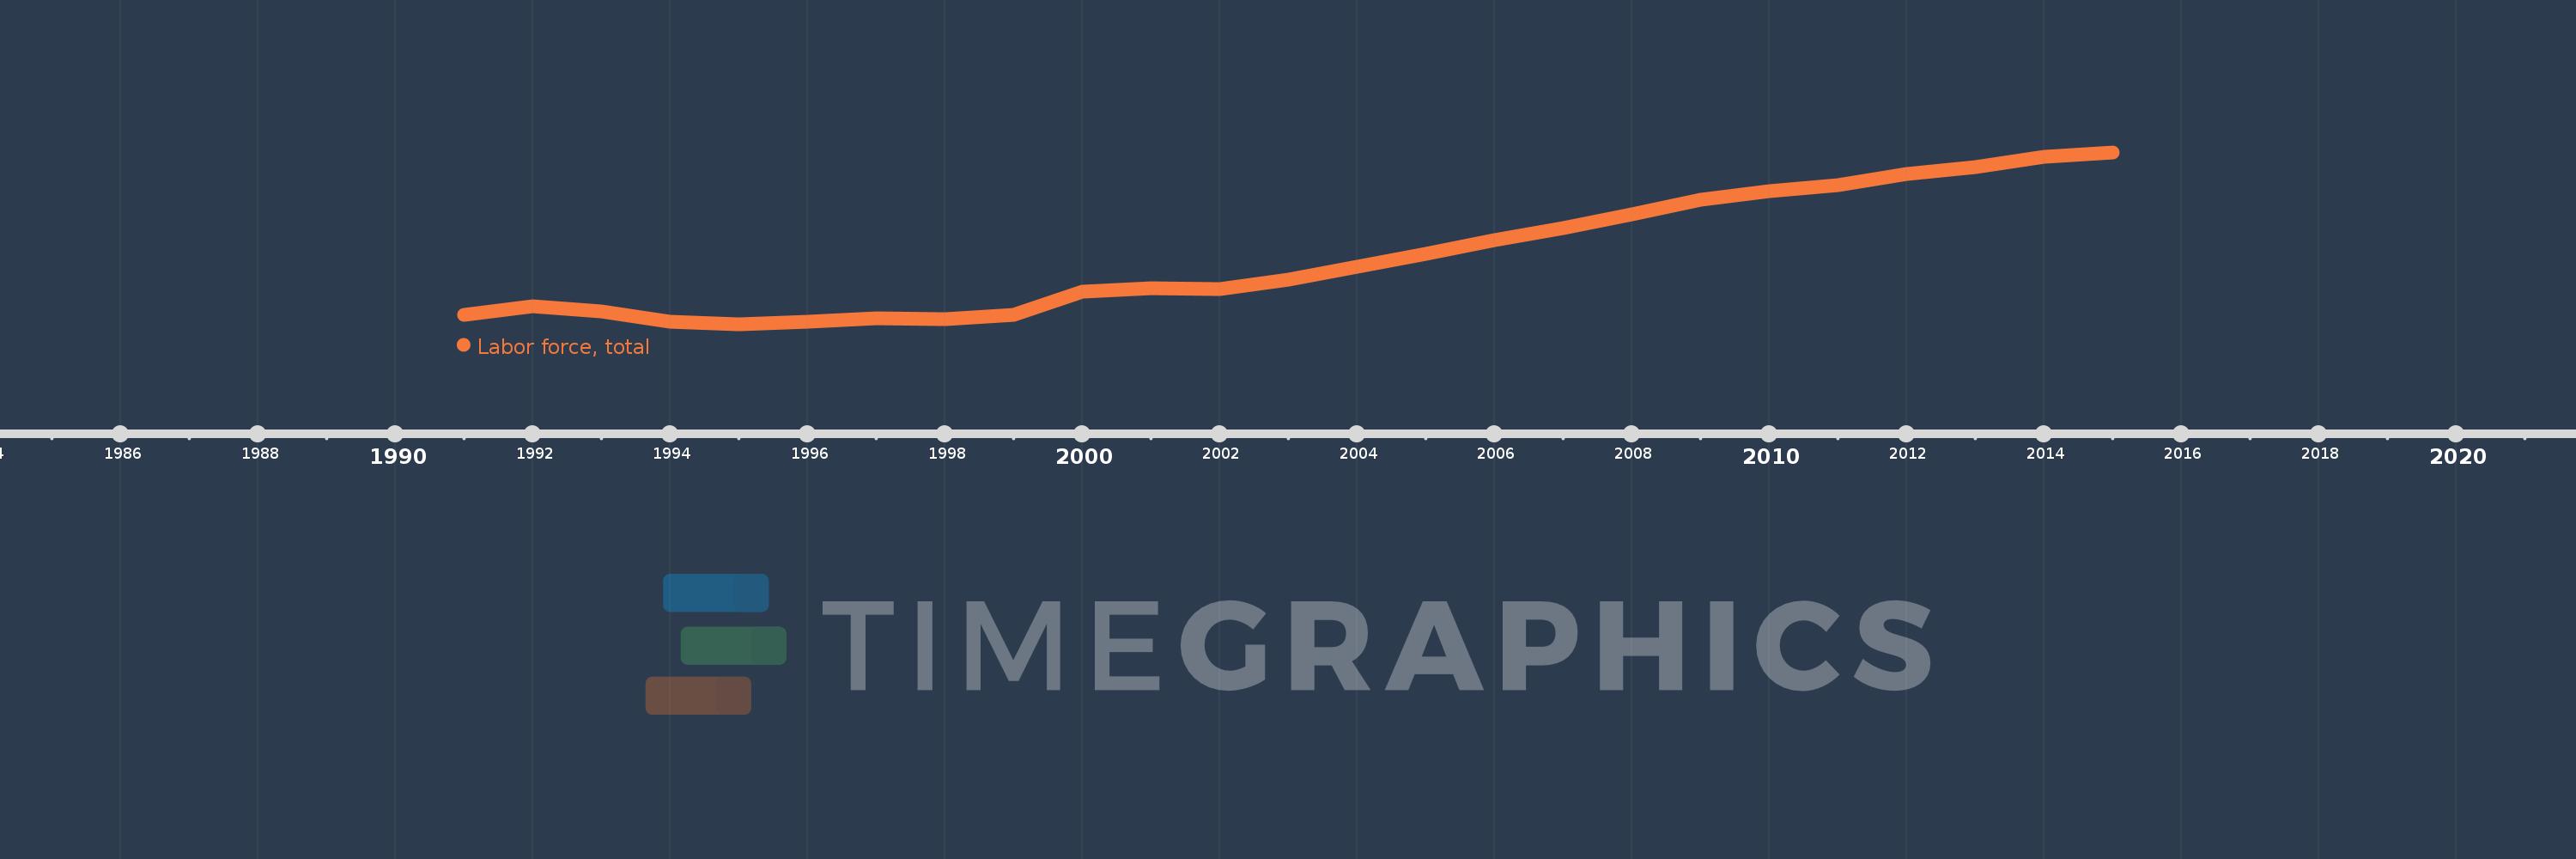
Cette échelle de temps montre un graphique de 1991 année à 2015 année Europe & Central Asia. Les données jusqu'à 1990 année ne sont pas présentés. Quantité d'observations actuelles selon dates: 25.
Source (désignation):
Les indicateurs du développement mondiale
Source (organisation):
International Labour Organization, using World Bank population estimates.
Catégories:
Education, Social Protection & Labor
Dernière mise à jour
23 avr. 2017
Les indicateurs de changement de valeurs selon les années
En moyenne:
405.638 mln.
Minimum:
386.331 mln.
1 janv. 1995
Maximum:
435.869 mln.
1 janv. 2015
Pour la date d''observation
Valeur
Changement absolu
Le changement par rapport à la valeur précédente
1 janv. 1991
388.926 mln.
+388.926 mln.
0.0%
1 janv. 1992
391.472 mln.
+2.545 mln.
0.65%
1 janv. 1993
390.014 mln.
-1.458 mln.
-0.37%
1 janv. 1994
387.118 mln.
-2.896 mln.
-0.74%
1 janv. 1995
386.331 mln.
-786.97 milles
-0.2%
1 janv. 1996
386.988 mln.
+656.841 milles
0.17%
1 janv. 1997
388.106 mln.
+1.119 mln.
0.29%
1 janv. 1998
387.871 mln.
-234.946 milles
-0.06%
1 janv. 1999
388.926 mln.
+1.055 mln.
0.27%
1 janv. 2000
395.636 mln.
+6.71 mln.
1.73%
1 janv. 2001
396.71 mln.
+1.075 mln.
0.27%
1 janv. 2002
396.514 mln.
-196.366 milles
-0.05%
1 janv. 2003
399.068 mln.
+2.554 mln.
0.64%
1 janv. 2004
402.803 mln.
+3.734 mln.
0.94%
1 janv. 2005
406.516 mln.
+3.713 mln.
0.92%
1 janv. 2006
410.548 mln.
+4.031 mln.
0.99%
1 janv. 2007
414.164 mln.
+3.616 mln.
0.88%
1 janv. 2008
418.125 mln.
+3.962 mln.
0.96%
1 janv. 2009
422.256 mln.
+4.131 mln.
0.99%
1 janv. 2010
424.606 mln.
+2.35 mln.
0.56%
1 janv. 2011
426.533 mln.
+1.927 mln.
0.45%
1 janv. 2012
429.607 mln.
+3.074 mln.
0.72%
1 janv. 2013
431.692 mln.
+2.086 mln.
0.49%
1 janv. 2014
434.555 mln.
+2.863 mln.
0.66%
1 janv. 2015
435.869 mln.
+1.314 mln.
0.3%
Classement des pays selon les statistiques actuelles par années

Commentaires:

Envoyer
PremiumAbout & FeedbackUn accordConfidentialité
logo
© 2022 Selected Technologies LLC – Morgan Hill, California