29
/fr/
fr
AIzaSyAYiBZKx7MnpbEhh9jyipgxe19OcubqV5w
April 1, 2024
41092
Late-demographic dividend
LTE
false
2
1
Stocks traded, total value (% of GDP)
2016,2015,2014,2013,2012,2011,2010,2009,2008,2007,2006,2005,2004,2003,2002,2001,2000,1999,1998,1997,1996,1995
Download
Bibliothèque de statistiques globales →Late-demographic dividend →

Stocks traded, total value (% of GDP)

Cette statistique dans les autres pays:
Arab WorldArgentinaArmeniaAustraliaAustriaBahrainBangladeshBarbadosBelgiumBermudaBoliviaBotswanaBrazilBulgariaCanadaCayman IslandsCentral Europe and the BalticsChannel IslandsChileChinaColombiaCosta RicaCote d'IvoireCroatiaCyprusCzech RepublicDenmarkEarly-demographic dividendEast Asia & PacificEast Asia & Pacific (excluding high income)East Asia & Pacific (IDA & IBRD countries)EcuadorEgypt, Arab Rep.El SalvadorEstoniaEuro areaEurope & Central AsiaEurope & Central Asia (excluding high income)Europe & Central Asia (IDA & IBRD countries)European UnionFijiFinlandFranceGeorgiaGermanyGhanaGreeceGuyanaHigh incomeHong Kong SAR, ChinaHungaryIBRD onlyIcelandIDA & IBRD totalIDA blendIDA totalIndiaIndonesiaIran, Islamic Rep.IrelandIsraelItalyJamaicaJapanJordanKazakhstanKenyaKorea, Rep.KuwaitKyrgyz RepublicLate-demographic dividendLatin America & Caribbean Latin America & Caribbean (excluding high income)Latin America & the Caribbean (IDA & IBRD countries)LatviaLebanonLithuaniaLow & middle incomeLower middle incomeLuxembourgMacedonia, FYRMalawiMalaysiaMaltaMauritiusMexicoMiddle East & North AfricaMiddle East & North Africa (excluding high income)Middle East & North Africa (IDA & IBRD countries)Middle incomeMoldovaMongoliaMontenegroMoroccoNamibiaNetherlandsNew ZealandNigeriaNorth AmericaNorwayOECD membersOmanOther small statesPakistanPanamaPapua New GuineaParaguayPeruPhilippinesPolandPortugalPost-demographic dividendQatarRomaniaRussian FederationSaudi ArabiaSerbiaSeychellesSingaporeSlovak RepublicSloveniaSouth AfricaSouth AsiaSouth Asia (IDA & IBRD)SpainSri LankaSt. Kitts and NevisSub-Saharan Africa Sub-Saharan Africa (excluding high income)Sub-Saharan Africa (IDA & IBRD countries)SwazilandSwedenSwitzerlandTanzaniaThailandTrinidad and TobagoTunisiaTurkeyUgandaUkraineUnited Arab EmiratesUnited KingdomUnited StatesUpper middle incomeUruguayUzbekistanVenezuela, RBVietnamWest Bank and GazaWorldZambiaZimbabwe
La ligne de temps
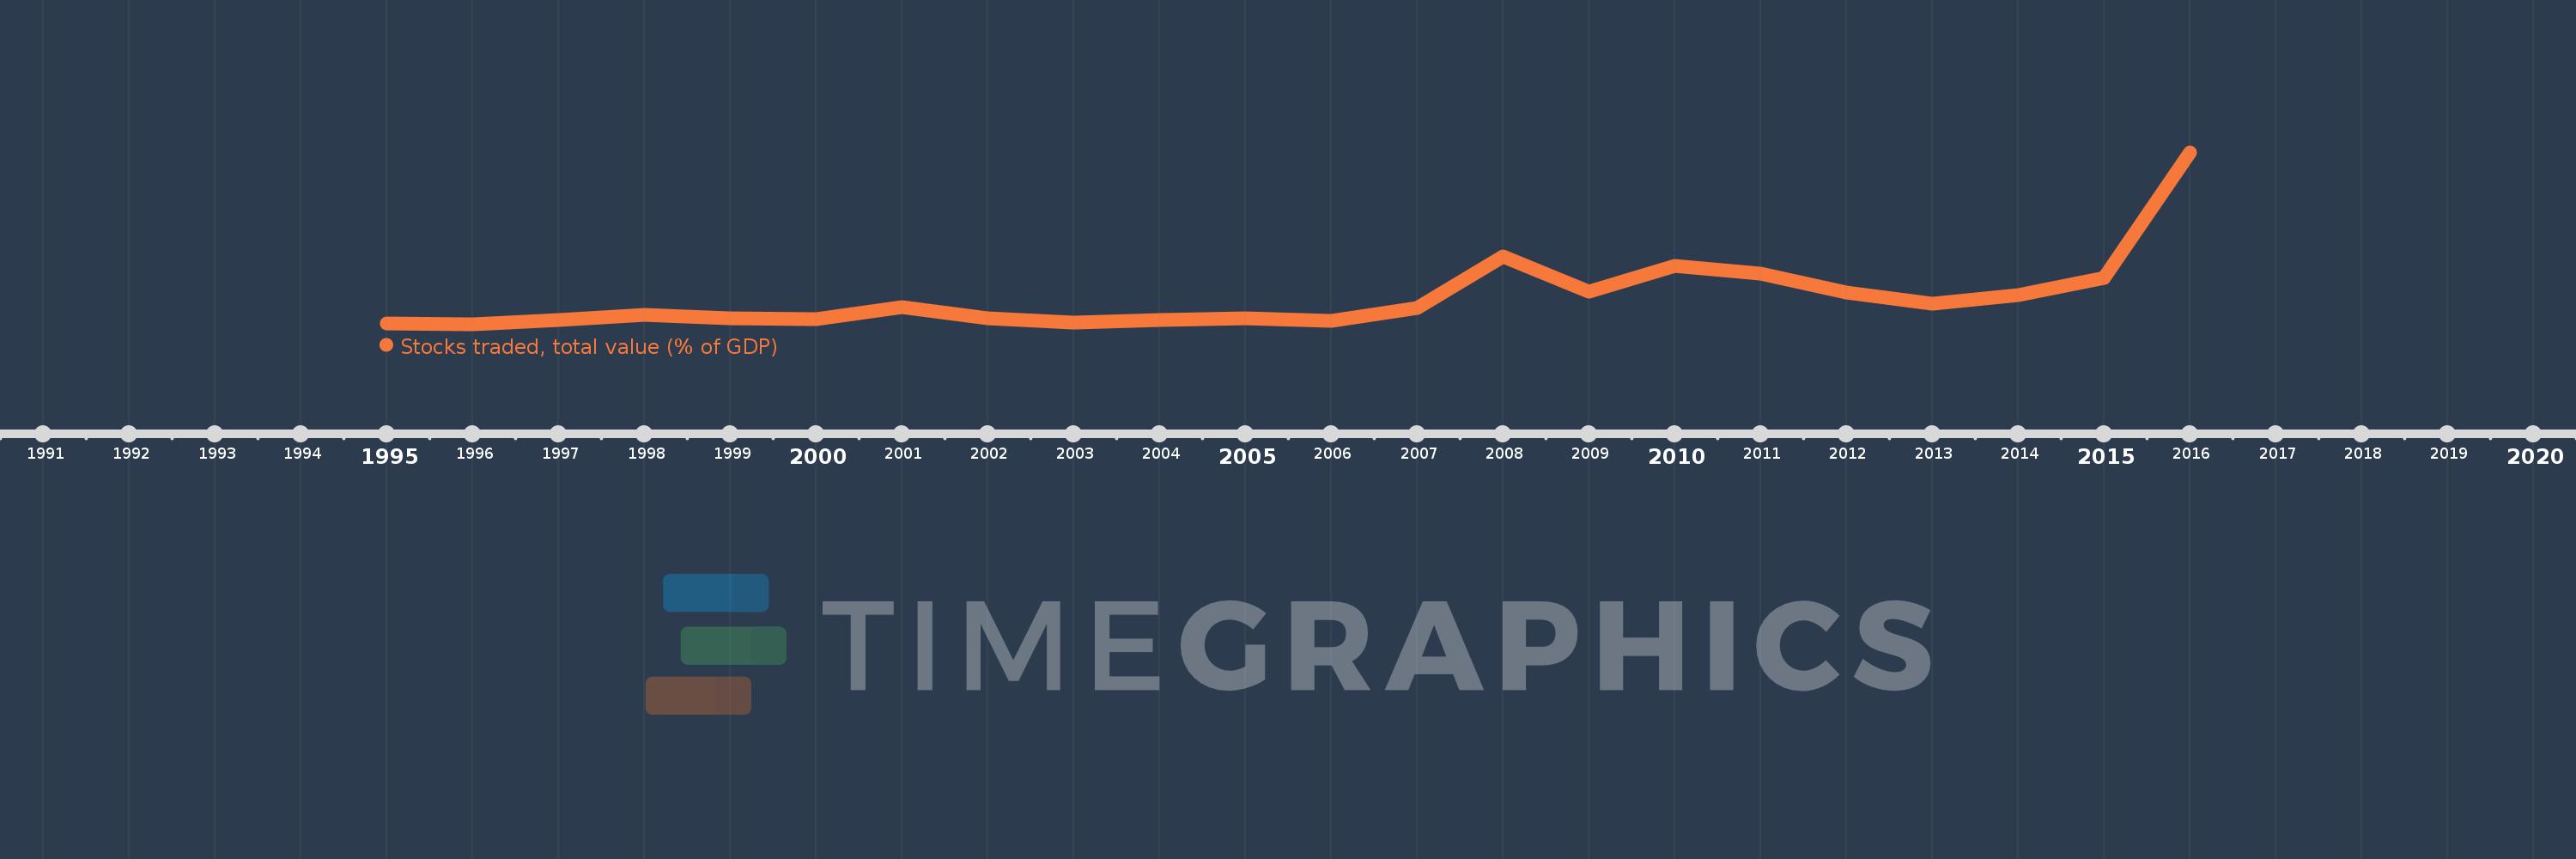
Cette échelle de temps montre un graphique de 1995 année à 2016 année Late-demographic dividend. Les données jusqu'à 1994 année ne sont pas présentés. Quantité d'observations actuelles selon dates: 22.
Source (désignation):
Les indicateurs du développement mondiale
Source (organisation):
World Federation of Exchanges database.
Catégories:
Financial Sector
Dernière mise à jour
23 avr. 2017
Les indicateurs de changement de valeurs selon les années
En moyenne:
47.759
Minimum:
13.369
1 janv. 1996
Maximum:
233.948
1 janv. 2016
Pour la date d''observation
Valeur
Changement absolu
Le changement par rapport à la valeur précédente
1 janv. 1995
14.788
+14.788
0.0%
1 janv. 1996
13.369
-1.42
-9.6%
1 janv. 1997
18.953
+5.584
41.77%
1 janv. 1998
25.879
+6.926
36.54%
1 janv. 1999
20.666
-5.213
-20.15%
1 janv. 2000
20.24
-0.426
-2.06%
1 janv. 2001
35.332
+15.092
74.56%
1 janv. 2002
20.671
-14.66
-41.49%
1 janv. 2003
15.258
-5.413
-26.19%
1 janv. 2004
18.396
+3.138
20.57%
1 janv. 2005
21.355
+2.959
16.09%
1 janv. 2006
18.101
-3.255
-15.24%
1 janv. 2007
34.271
+16.17
89.33%
1 janv. 2008
99.901
+65.63
191.5%
1 janv. 2009
54.994
-44.907
-44.95%
1 janv. 2010
88.407
+33.413
60.76%
1 janv. 2011
78.826
-9.582
-10.84%
1 janv. 2012
53.849
-24.977
-31.69%
1 janv. 2013
39.929
-13.92
-25.85%
1 janv. 2014
51.247
+11.318
28.34%
1 janv. 2015
72.326
+21.079
41.13%
1 janv. 2016
233.948
+161.622
223.46%
Classement des pays selon les statistiques actuelles par années

Commentaires:

Envoyer
PremiumAbout & FeedbackUn accordConfidentialité
logo
© 2022 Selected Technologies LLC – Morgan Hill, California