33
/fr/
AIzaSyAYiBZKx7MnpbEhh9jyipgxe19OcubqV5w
August 1, 2025
154032
Iceland
ISL
true
2
1
Stocks traded, total value (% of GDP)
2005,2004,2003,2002,2001,2000,1999,1998,1997,1996,1995,1994
Download
Bibliothèque de statistiques globales →Iceland →

Stocks traded, total value (% of GDP)

Cette statistique dans les autres pays:

Arab WorldArgentinaArmeniaAustraliaAustriaBahrainBangladeshBarbadosBelgiumBermudaBoliviaBotswanaBrazilBulgariaCanadaCayman IslandsCentral Europe and the BalticsChannel IslandsChileChinaColombiaCosta RicaCote d'IvoireCroatiaCyprusCzech RepublicDenmarkEarly-demographic dividendEast Asia & PacificEast Asia & Pacific (excluding high income)East Asia & Pacific (IDA & IBRD countries)EcuadorEgypt, Arab Rep.El SalvadorEstoniaEuro areaEurope & Central AsiaEurope & Central Asia (excluding high income)Europe & Central Asia (IDA & IBRD countries)European UnionFijiFinlandFranceGeorgiaGermanyGhanaGreeceGuyanaHigh incomeHong Kong SAR, ChinaHungaryIBRD onlyIcelandIDA & IBRD totalIDA blendIDA totalIndiaIndonesiaIran, Islamic Rep.IrelandIsraelItalyJamaicaJapanJordanKazakhstanKenyaKorea, Rep.KuwaitKyrgyz RepublicLate-demographic dividendLatin America & Caribbean Latin America & Caribbean (excluding high income)Latin America & the Caribbean (IDA & IBRD countries)LatviaLebanonLithuaniaLow & middle incomeLower middle incomeLuxembourgMacedonia, FYRMalawiMalaysiaMaltaMauritiusMexicoMiddle East & North AfricaMiddle East & North Africa (excluding high income)Middle East & North Africa (IDA & IBRD countries)Middle incomeMoldovaMongoliaMontenegroMoroccoNamibiaNetherlandsNew ZealandNigeriaNorth AmericaNorwayOECD membersOmanOther small statesPakistanPanamaPapua New GuineaParaguayPeruPhilippinesPolandPortugalPost-demographic dividendQatarRomaniaRussian FederationSaudi ArabiaSerbiaSeychellesSingaporeSlovak RepublicSloveniaSouth AfricaSouth AsiaSouth Asia (IDA & IBRD)SpainSri LankaSt. Kitts and NevisSub-Saharan Africa Sub-Saharan Africa (excluding high income)Sub-Saharan Africa (IDA & IBRD countries)SwazilandSwedenSwitzerlandTanzaniaThailandTrinidad and TobagoTunisiaTurkeyUgandaUkraineUnited Arab EmiratesUnited KingdomUnited StatesUpper middle incomeUruguayUzbekistanVenezuela, RBVietnamWest Bank and GazaWorldZambiaZimbabwe

La ligne de temps

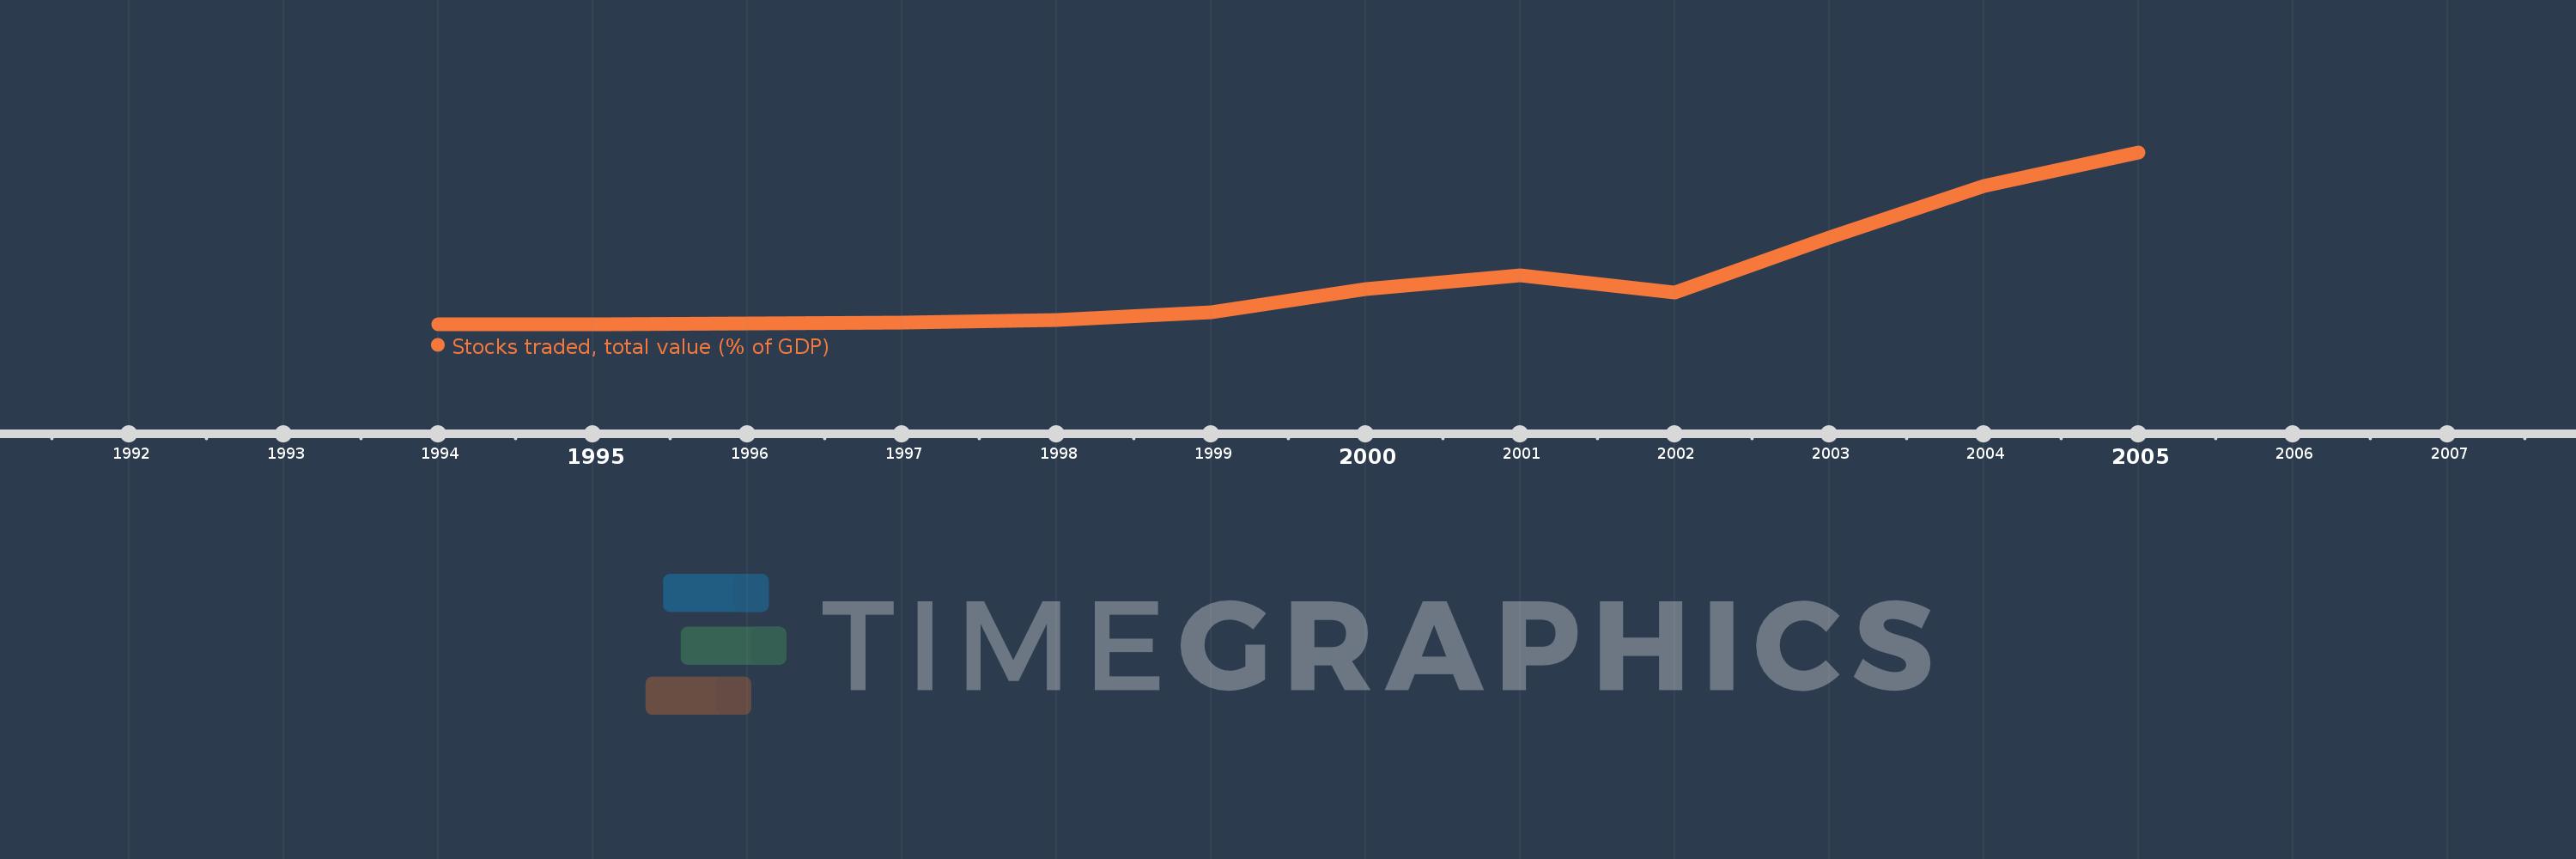
Cette échelle de temps montre un graphique de 1994 année à 2005 année Iceland. Les données jusqu'à 1993 année ne sont pas présentés. Quantité d'observations actuelles selon dates: 12.

Source (désignation):

Les indicateurs du développement mondiale

Source (organisation):

World Federation of Exchanges database.

Catégories:

Financial Sector

Dernière mise à jour

23 avr. 2017

Les indicateurs de changement de valeurs selon les années

En moyenne:
22.238
Minimum:
0.211
1 janv. 1994
Maximum:
85.631
1 janv. 2005
Pour la date d''observation
Valeur
Changement absolu
Le changement par rapport à la valeur précédente
1 janv. 1994
0.211
+0.211
0.0%
1 janv. 1995
0.303
+0.092
43.78%
1 janv. 1996
0.61
+0.307
101.47%
1 janv. 1997
1.132
+0.522
85.56%
1 janv. 1998
2.381
+1.25
110.43%
1 janv. 1999
6.112
+3.731
156.65%
1 janv. 2000
17.605
+11.493
188.03%
1 janv. 2001
24.711
+7.106
40.36%
1 janv. 2002
15.776
-8.935
-36.16%
1 janv. 2003
43.262
+27.486
174.22%
1 janv. 2004
69.122
+25.86
59.77%
1 janv. 2005
85.631
+16.509
23.88%

Classement des pays selon les statistiques actuelles par années