30
/fr/
AIzaSyAYiBZKx7MnpbEhh9jyipgxe19OcubqV5w
April 1, 2024
37808
IDA & IBRD total
IBT
false
2
1
Stocks traded, total value (% of GDP)
2016,2015,2014,2013,2012,2011,2010,2009,2008,2007,2006,2005,2004,2003,2002,2001,2000,1999,1998,1997,1996,1995,1994
Download
Bibliothèque de statistiques globales →IDA & IBRD total →

Stocks traded, total value (% of GDP)

Cette statistique dans les autres pays:

Arab WorldArgentinaArmeniaAustraliaAustriaBahrainBangladeshBarbadosBelgiumBermudaBoliviaBotswanaBrazilBulgariaCanadaCayman IslandsCentral Europe and the BalticsChannel IslandsChileChinaColombiaCosta RicaCote d'IvoireCroatiaCyprusCzech RepublicDenmarkEarly-demographic dividendEast Asia & PacificEast Asia & Pacific (excluding high income)East Asia & Pacific (IDA & IBRD countries)EcuadorEgypt, Arab Rep.El SalvadorEstoniaEuro areaEurope & Central AsiaEurope & Central Asia (excluding high income)Europe & Central Asia (IDA & IBRD countries)European UnionFijiFinlandFranceGeorgiaGermanyGhanaGreeceGuyanaHigh incomeHong Kong SAR, ChinaHungaryIBRD onlyIcelandIDA & IBRD totalIDA blendIDA totalIndiaIndonesiaIran, Islamic Rep.IrelandIsraelItalyJamaicaJapanJordanKazakhstanKenyaKorea, Rep.KuwaitKyrgyz RepublicLate-demographic dividendLatin America & Caribbean Latin America & Caribbean (excluding high income)Latin America & the Caribbean (IDA & IBRD countries)LatviaLebanonLithuaniaLow & middle incomeLower middle incomeLuxembourgMacedonia, FYRMalawiMalaysiaMaltaMauritiusMexicoMiddle East & North AfricaMiddle East & North Africa (excluding high income)Middle East & North Africa (IDA & IBRD countries)Middle incomeMoldovaMongoliaMontenegroMoroccoNamibiaNetherlandsNew ZealandNigeriaNorth AmericaNorwayOECD membersOmanOther small statesPakistanPanamaPapua New GuineaParaguayPeruPhilippinesPolandPortugalPost-demographic dividendQatarRomaniaRussian FederationSaudi ArabiaSerbiaSeychellesSingaporeSlovak RepublicSloveniaSouth AfricaSouth AsiaSouth Asia (IDA & IBRD)SpainSri LankaSt. Kitts and NevisSub-Saharan Africa Sub-Saharan Africa (excluding high income)Sub-Saharan Africa (IDA & IBRD countries)SwazilandSwedenSwitzerlandTanzaniaThailandTrinidad and TobagoTunisiaTurkeyUgandaUkraineUnited Arab EmiratesUnited KingdomUnited StatesUpper middle incomeUruguayUzbekistanVenezuela, RBVietnamWest Bank and GazaWorldZambiaZimbabwe

La ligne de temps

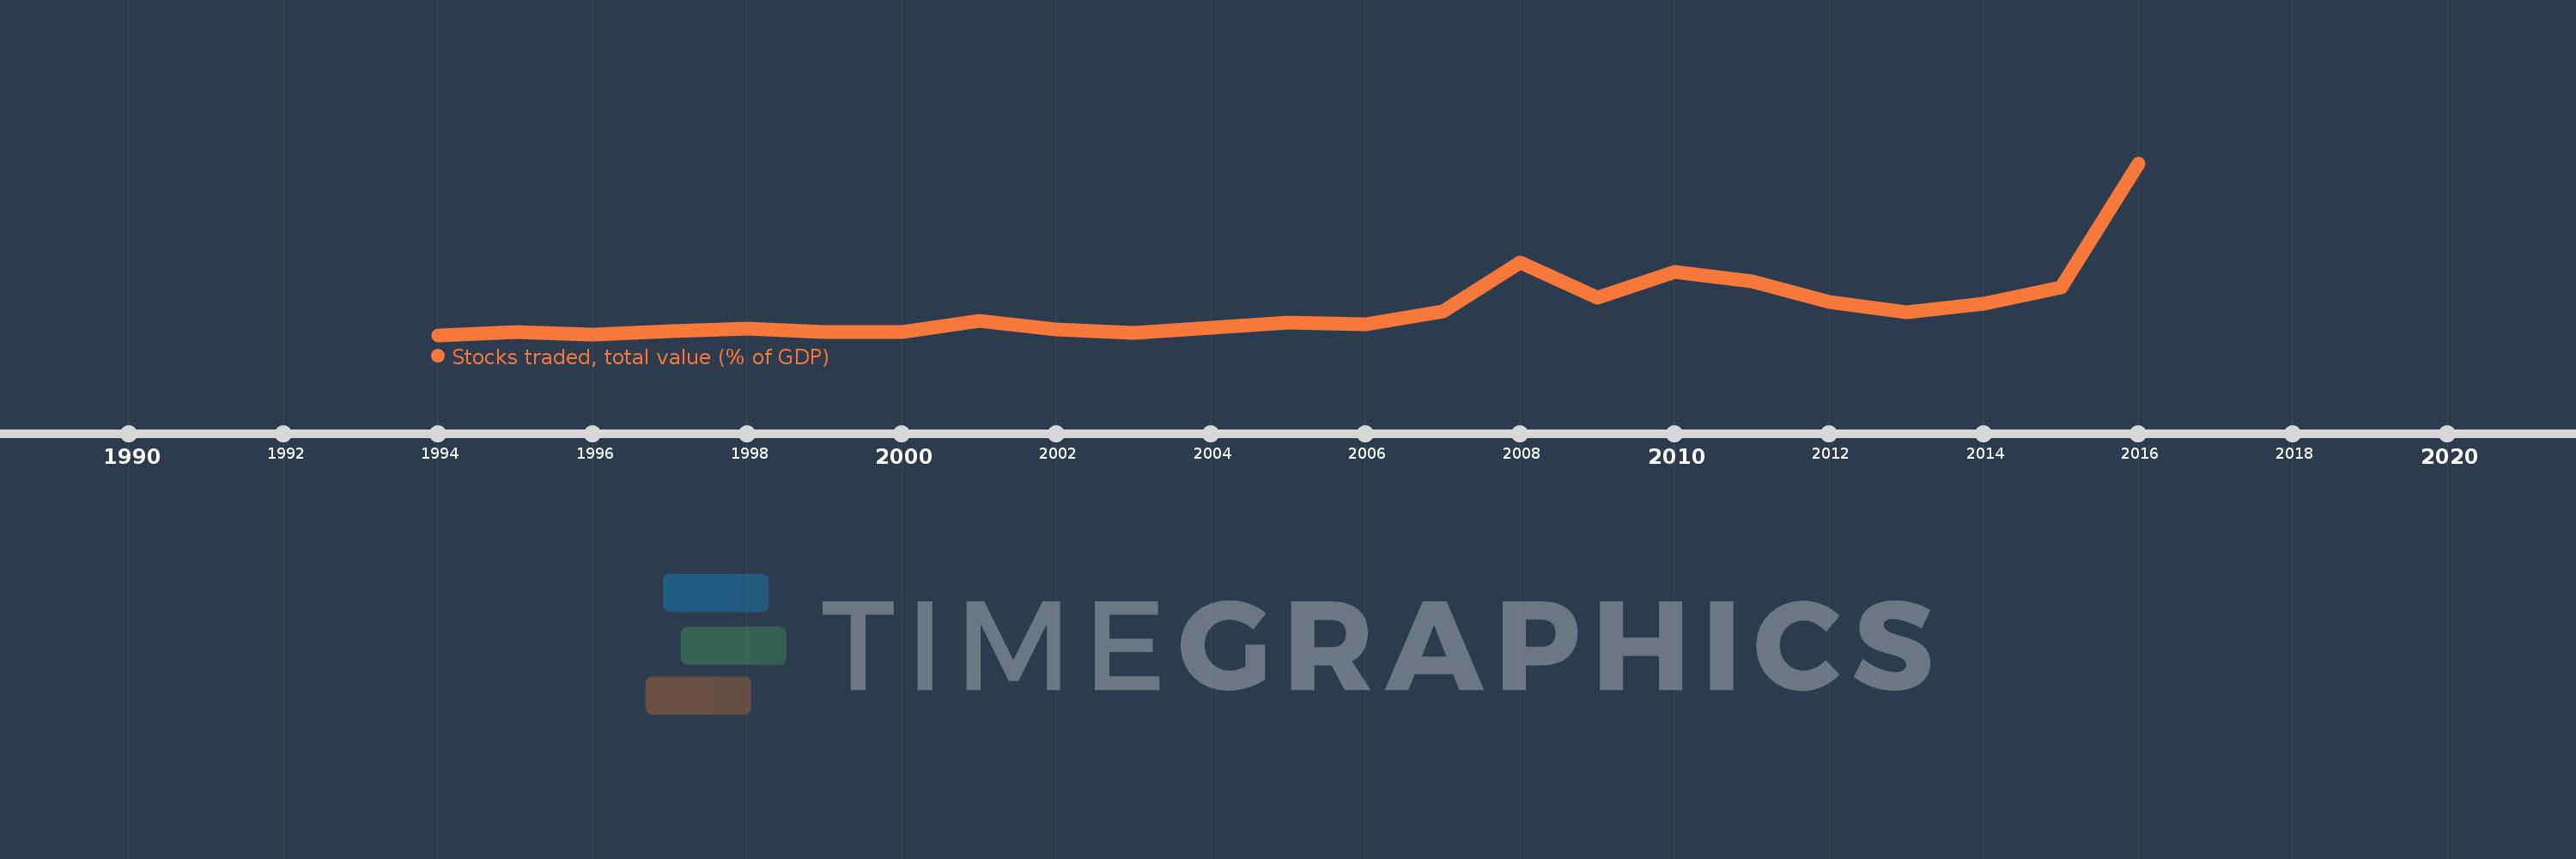
Cette échelle de temps montre un graphique de 1994 année à 2016 année IDA & IBRD total. Les données jusqu'à 1993 année ne sont pas présentés. Quantité d'observations actuelles selon dates: 23.

Source (désignation):

Les indicateurs du développement mondiale

Source (organisation):

World Federation of Exchanges database.

Catégories:

Financial Sector

Dernière mise à jour

23 avr. 2017

Les indicateurs de changement de valeurs selon les années

En moyenne:
38.088
Minimum:
11.654
1 janv. 1994
Maximum:
177.314
1 janv. 2016
Pour la date d''observation
Valeur
Changement absolu
Le changement par rapport à la valeur précédente
1 janv. 1994
11.654
+11.654
0.0%
1 janv. 1995
14.755
+3.102
26.61%
1 janv. 1996
11.883
-2.872
-19.47%
1 janv. 1997
15.626
+3.743
31.5%
1 janv. 1998
18.225
+2.599
16.63%
1 janv. 1999
14.773
-3.453
-18.94%
1 janv. 2000
14.677
-0.095
-0.64%
1 janv. 2001
25.256
+10.578
72.07%
1 janv. 2002
17.174
-8.082
-32.0%
1 janv. 2003
14.073
-3.101
-18.06%
1 janv. 2004
18.844
+4.771
33.9%
1 janv. 2005
23.834
+4.99
26.48%
1 janv. 2006
21.671
-2.163
-9.08%
1 janv. 2007
34.159
+12.487
57.62%
1 janv. 2008
81.54
+47.381
138.71%
1 janv. 2009
47.842
-33.698
-41.33%
1 janv. 2010
72.244
+24.402
51.01%
1 janv. 2011
63.222
-9.022
-12.49%
1 janv. 2012
43.606
-19.615
-31.03%
1 janv. 2013
33.952
-9.655
-22.14%
1 janv. 2014
42.284
+8.332
24.54%
1 janv. 2015
57.41
+15.126
35.77%
1 janv. 2016
177.314
+119.904
208.86%

Classement des pays selon les statistiques actuelles par années