29
/fr/
fr
AIzaSyAYiBZKx7MnpbEhh9jyipgxe19OcubqV5w
April 1, 2024
40232
IDA total
IDA
false
2
1
Percentage of teachers in secondary education who are trained, both sexes (%)
2015,2014,2013,2012,2011,2010,2009,2008,2007,2006
Download
Bibliothèque de statistiques globales →IDA total →

Percentage of teachers in secondary education who are trained, both sexes (%)

Cette statistique dans les autres pays:
AndorraAntigua and BarbudaArab WorldArubaBahamas, TheBahrainBangladeshBarbadosBelarusBelizeBeninBermudaBhutanBotswanaBritish Virgin IslandsBrunei DarussalamBurkina FasoBurundiCabo VerdeCambodiaCameroonCaribbean small statesCayman IslandsChadColombiaComorosCongo, Dem. Rep.Congo, Rep.Costa RicaCote d'IvoireCroatiaCubaDjiboutiDominicaDominican RepublicEcuadorEgypt, Arab Rep.El SalvadorEquatorial GuineaEritreaEthiopiaFijiFragile and conflict affected situationsGambia, TheGeorgiaGhanaGibraltarGrenadaGuineaGuyanaHeavily indebted poor countries (HIPC)HondurasHong Kong SAR, ChinaIDA blendIDA onlyIDA totalIran, Islamic Rep.IraqJamaicaKazakhstanKenyaKiribatiKuwaitKyrgyz RepublicLao PDRLatin America & Caribbean Latin America & Caribbean (excluding high income)Latin America & the Caribbean (IDA & IBRD countries)Least developed countries: UN classificationLebanonLesothoLiberiaLow incomeMacao SAR, ChinaMadagascarMalawiMalaysiaMaldivesMaliMauritaniaMauritiusMexicoMiddle East & North AfricaMiddle East & North Africa (excluding high income)Middle East & North Africa (IDA & IBRD countries)MongoliaMozambiqueMyanmarNamibiaNauruNepalNicaraguaNigerNigeriaOmanOther small statesPacific island small statesPanamaPapua New GuineaParaguayPeruPhilippinesPre-demographic dividendQatarRwandaSao Tome and PrincipeSaudi ArabiaSerbiaSeychellesSierra LeoneSingaporeSmall statesSolomon IslandsSri LankaSt. Kitts and NevisSt. LuciaSt. Vincent and the GrenadinesSub-Saharan Africa Sub-Saharan Africa (excluding high income)Sub-Saharan Africa (IDA & IBRD countries)SudanSurinameSwazilandSyrian Arab RepublicTajikistanTogoTongaTurks and Caicos IslandsUgandaUnited Arab EmiratesUzbekistanWest Bank and GazaZimbabwe
La ligne de temps
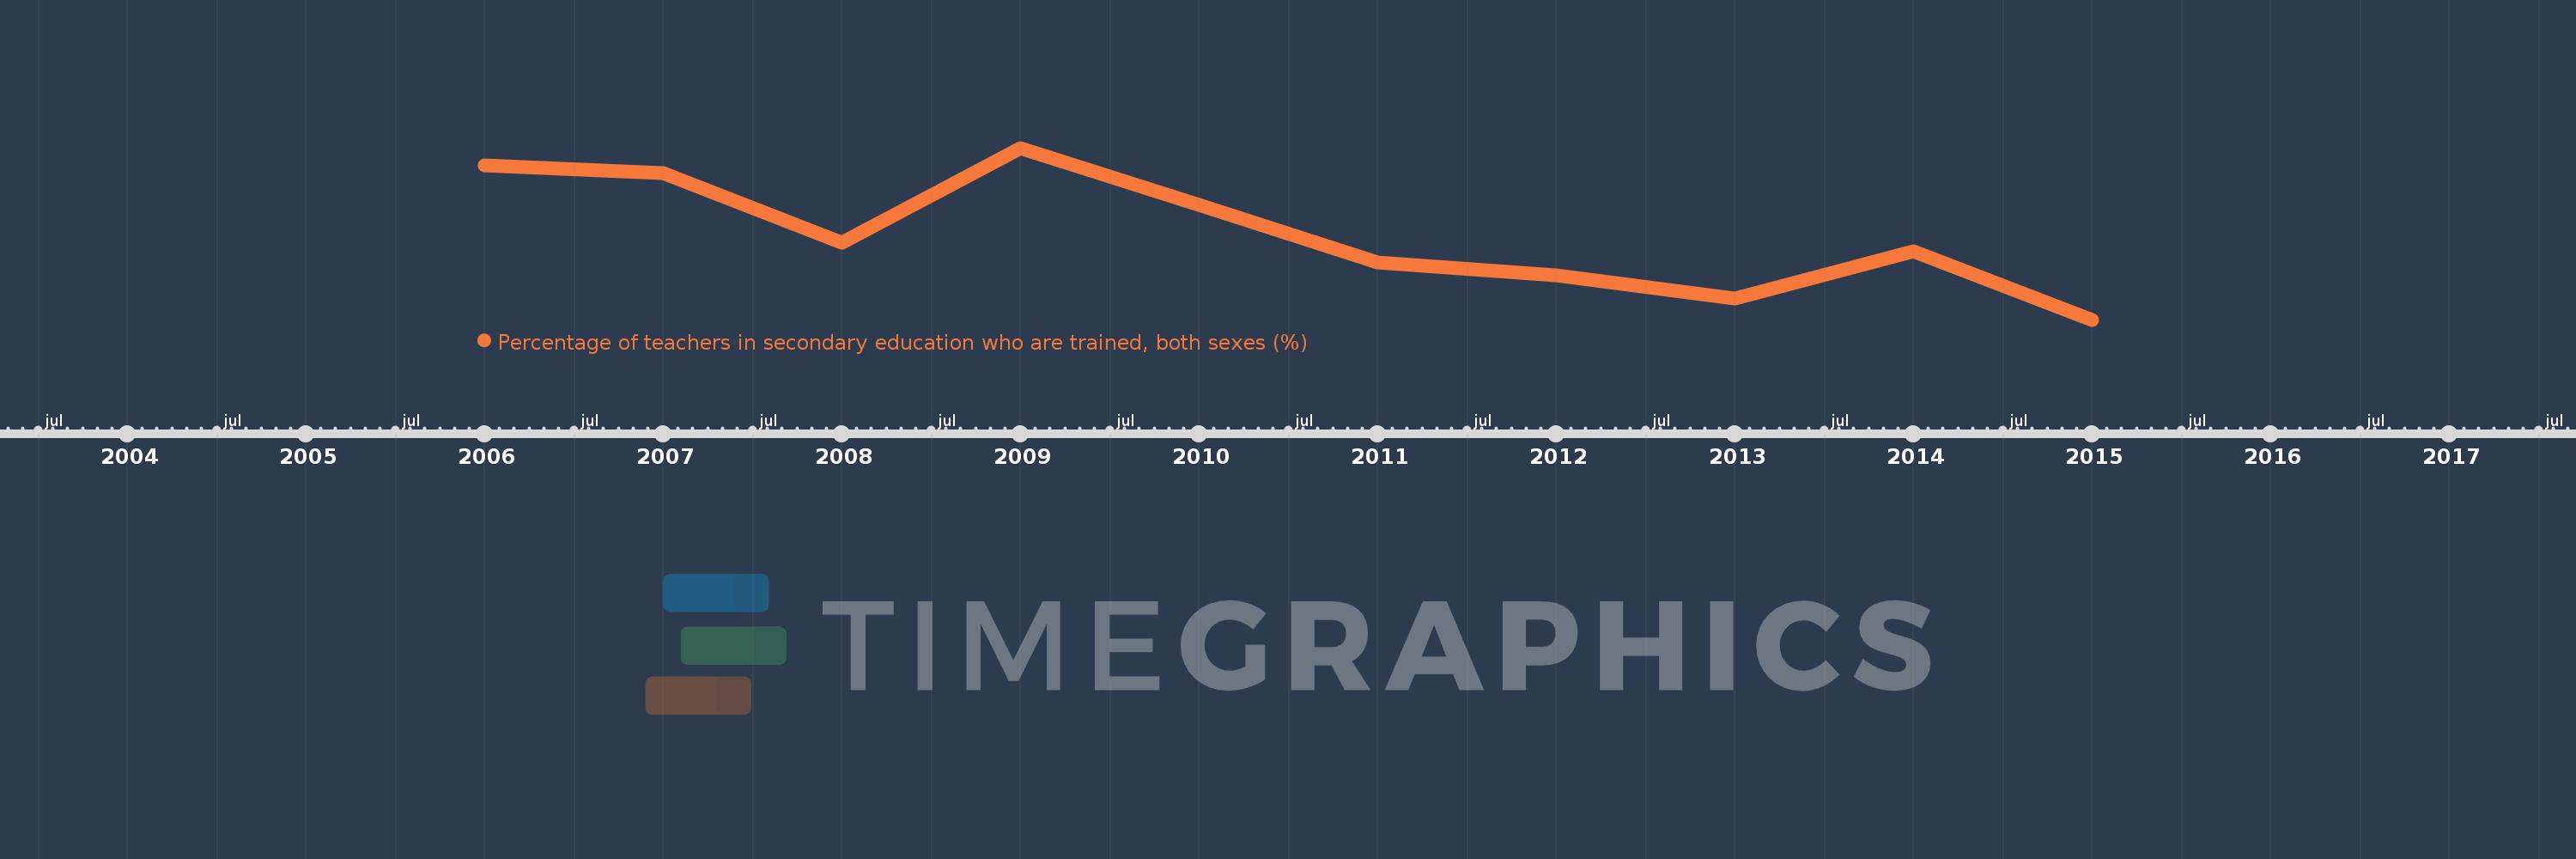
Cette échelle de temps montre un graphique de 2006 année à 2015 année IDA total. Les données jusqu'à 2005 année ne sont pas présentés. Quantité d'observations actuelles selon dates: 10.
Source (désignation):
Les indicateurs du développement mondiale
Source (organisation):
UNESCO Institute for Statistics
Catégories:
Education
Dernière mise à jour
23 avr. 2017
Les indicateurs de changement de valeurs selon les années
En moyenne:
70.631
Minimum:
66.705
1 janv. 2015
Maximum:
74.576
1 janv. 2009
Pour la date d''observation
Valeur
Changement absolu
Le changement par rapport à la valeur précédente
1 janv. 2006
73.792
+73.792
0.0%
1 janv. 2007
73.42
-0.372
-0.5%
1 janv. 2008
70.237
-3.183
-4.34%
1 janv. 2009
74.576
+4.339
6.18%
1 janv. 2010
71.968
-2.608
-3.5%
1 janv. 2011
69.324
-2.644
-3.67%
1 janv. 2012
68.756
-0.568
-0.82%
1 janv. 2013
67.686
-1.07
-1.56%
1 janv. 2014
69.85
+2.163
3.2%
1 janv. 2015
66.705
-3.145
-4.5%
Classement des pays selon les statistiques actuelles par années

Commentaires:

Envoyer
PremiumAbout & FeedbackUn accordConfidentialité
logo
© 2022 Selected Technologies LLC – Morgan Hill, California