33
/fr/
AIzaSyAYiBZKx7MnpbEhh9jyipgxe19OcubqV5w
August 1, 2025
32562
Europe & Central Asia (IDA & IBRD countries)
TEC
false
2
1
Expense (% of GDP)
2015,2014,2013,2012,2011,2010,2009,2008,2007,2006,2005,2004,2003,2002,2001,2000,1999,1996,1995
Download
Bibliothèque de statistiques globales →Europe & Central Asia (IDA & IBRD countries) →

Expense (% of GDP)

Cette statistique dans les autres pays:

AfghanistanAlbaniaAlgeriaAngolaAntigua and BarbudaArmeniaAustraliaAustriaAzerbaijanBahamas, TheBahrainBangladeshBarbadosBelarusBelgiumBelizeBeninBhutanBoliviaBosnia and HerzegovinaBotswanaBrazilBulgariaBurkina FasoBurundiCabo VerdeCambodiaCanadaCaribbean small statesCentral African RepublicCentral Europe and the BalticsChileColombiaCongo, Dem. Rep.Congo, Rep.Costa RicaCote d'IvoireCroatiaCyprusCzech RepublicDenmarkDominicaDominican RepublicEarly-demographic dividendEgypt, Arab Rep.El SalvadorEquatorial GuineaEstoniaEthiopiaEuro areaEurope & Central AsiaEurope & Central Asia (excluding high income)Europe & Central Asia (IDA & IBRD countries)European UnionFijiFinlandFranceGambia, TheGeorgiaGermanyGhanaGreeceGrenadaGuatemalaHeavily indebted poor countries (HIPC)High incomeHondurasHong Kong SAR, ChinaHungaryIcelandIDA blendIDA onlyIDA totalIndiaIndonesiaIran, Islamic Rep.IraqIrelandIsraelItalyJamaicaJapanJordanKazakhstanKenyaKiribatiKorea, Rep.KuwaitKyrgyz RepublicLao PDRLatin America & Caribbean Latin America & Caribbean (excluding high income)Latin America & the Caribbean (IDA & IBRD countries)LatviaLeast developed countries: UN classificationLebanonLesothoLiberiaLithuaniaLow incomeLower middle incomeLuxembourgMacao SAR, ChinaMacedonia, FYRMadagascarMalawiMalaysiaMaldivesMaliMaltaMauritiusMexicoMicronesia, Fed. Sts.Middle East & North Africa (excluding high income)Middle East & North Africa (IDA & IBRD countries)MoldovaMongoliaMoroccoMozambiqueMyanmarNamibiaNepalNetherlandsNew ZealandNicaraguaNigeriaNorth AmericaNorwayOECD membersOmanOther small statesPacific island small statesPakistanPanamaPapua New GuineaParaguayPeruPhilippinesPolandPortugalPost-demographic dividendPre-demographic dividendQatarRomaniaRussian FederationRwandaSamoaSan MarinoSao Tome and PrincipeSenegalSerbiaSeychellesSierra LeoneSingaporeSlovak RepublicSloveniaSmall statesSolomon IslandsSouth AfricaSouth AsiaSouth Asia (IDA & IBRD)SpainSri LankaSt. Kitts and NevisSt. LuciaSub-Saharan Africa Sub-Saharan Africa (excluding high income)Sub-Saharan Africa (IDA & IBRD countries)SurinameSwazilandSwedenSwitzerlandSyrian Arab RepublicTajikistanTanzaniaThailandTimor-LesteTogoTrinidad and TobagoTunisiaTurkeyUgandaUkraineUnited Arab EmiratesUnited KingdomUnited StatesUruguayVanuatuVenezuela, RBVietnamWest Bank and GazaWorldYemen, Rep.ZambiaZimbabwe

La ligne de temps

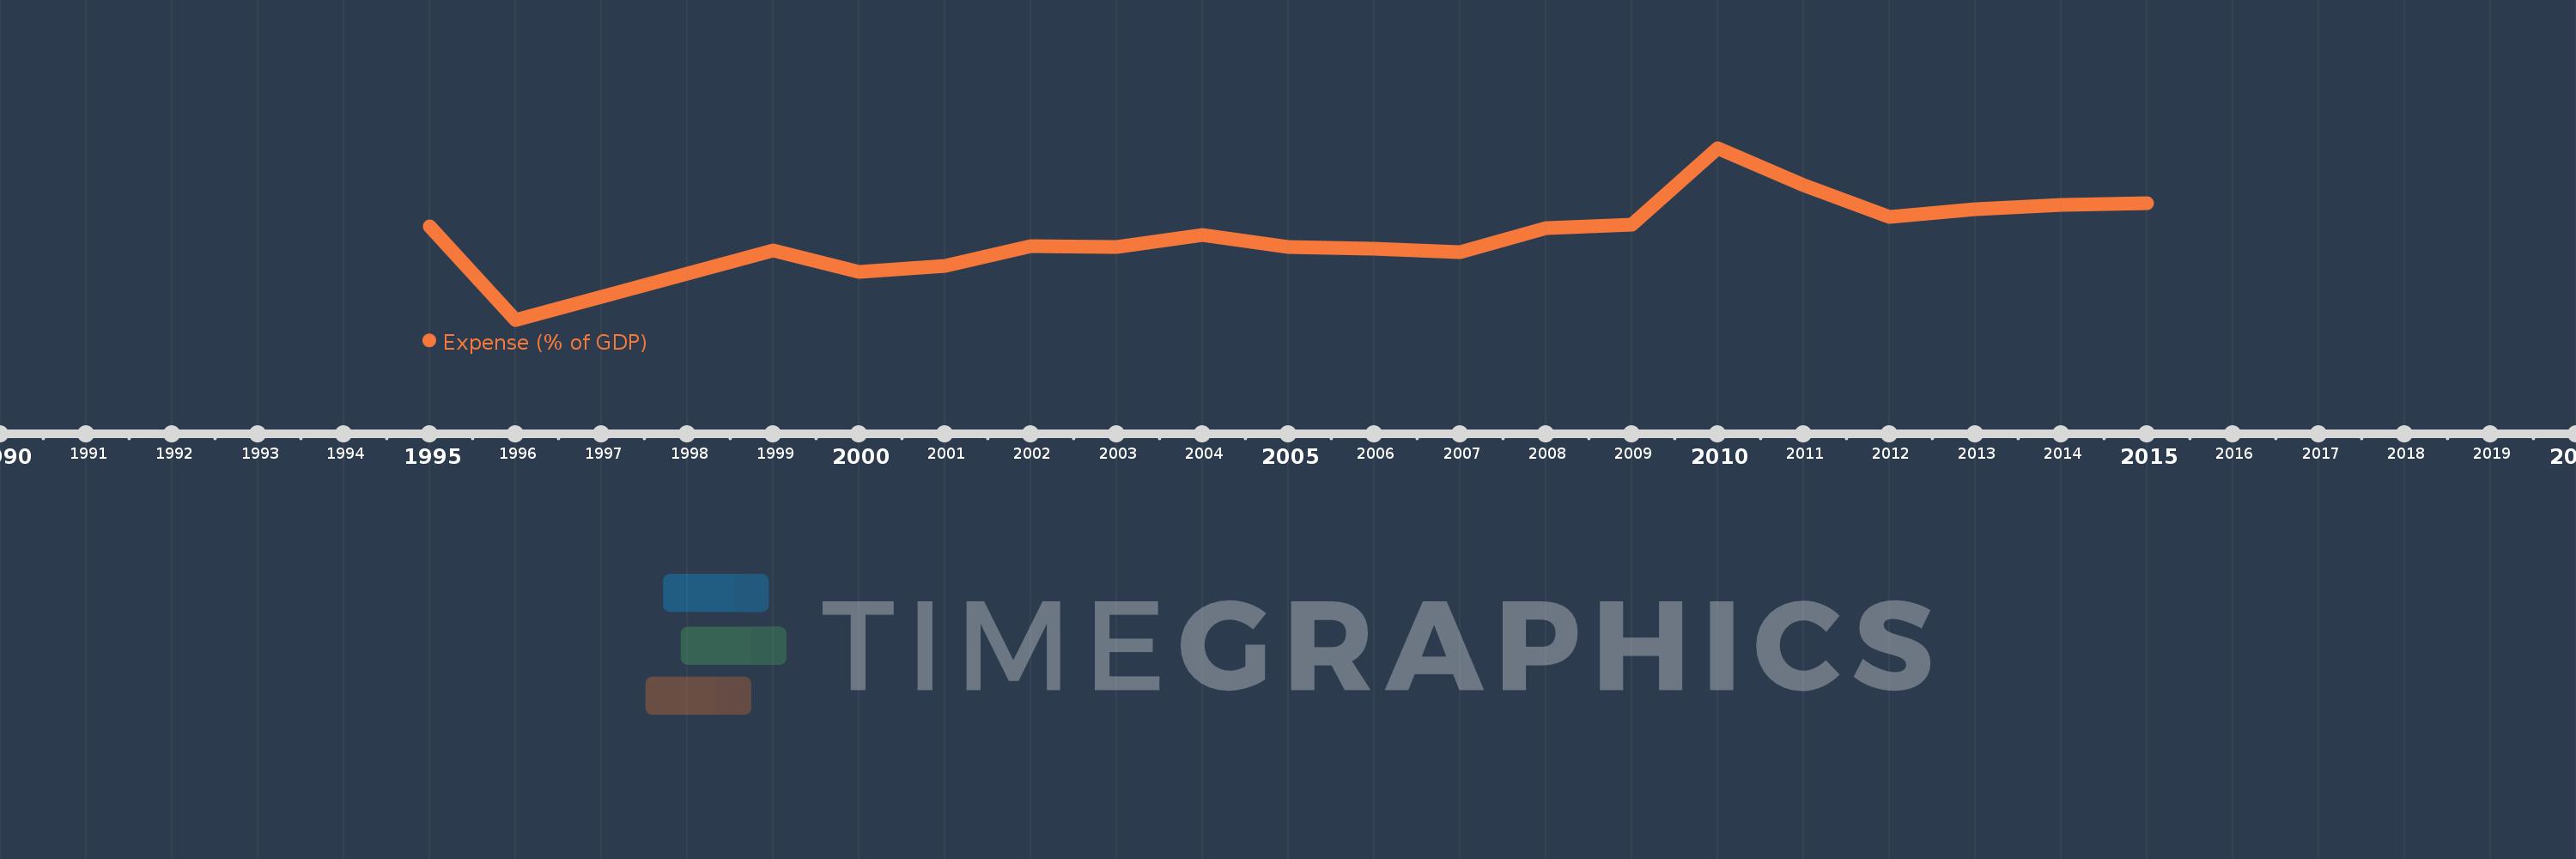
Cette échelle de temps montre un graphique de 1995 année à 2015 année Europe & Central Asia (IDA & IBRD countries). Les données jusqu'à 1994 année ne sont pas présentés. Quantité d'observations actuelles selon dates: 19.

Source (désignation):

Les indicateurs du développement mondiale

Source (organisation):

International Monetary Fund, Government Finance Statistics Yearbook and data files, and World Bank and OECD GDP estimates.

Catégories:

Economy & Growth, Public Sector

Dernière mise à jour

23 avr. 2017

Les indicateurs de changement de valeurs selon les années

En moyenne:
27.289
Minimum:
19.963
1 janv. 1996
Maximum:
34.491
1 janv. 2010
Pour la date d''observation
Valeur
Changement absolu
Le changement par rapport à la valeur précédente
1 janv. 1995
27.882
+27.882
0.0%
1 janv. 1996
19.963
-7.918
-28.4%
1 janv. 1999
25.821
+5.857
29.34%
1 janv. 2000
24.01
-1.811
-7.01%
1 janv. 2001
24.54
+0.53
2.21%
1 janv. 2002
26.202
+1.662
6.77%
1 janv. 2003
26.149
-0.053
-0.2%
1 janv. 2004
27.1
+0.95
3.63%
1 janv. 2005
26.139
-0.961
-3.55%
1 janv. 2006
25.975
-0.164
-0.63%
1 janv. 2007
25.681
-0.293
-1.13%
1 janv. 2008
27.727
+2.046
7.97%
1 janv. 2009
28.016
+0.289
1.04%
1 janv. 2010
34.491
+6.475
23.11%
1 janv. 2011
31.35
-3.142
-9.11%
1 janv. 2012
28.636
-2.714
-8.66%
1 janv. 2013
29.348
+0.712
2.48%
1 janv. 2014
29.645
+0.297
1.01%
1 janv. 2015
29.822
+0.177
0.6%

Classement des pays selon les statistiques actuelles par années